Chapter: Pharmaceutical Drug Analysis: Infrared Spectrophotometry
Applications of IR-Spectroscopy in Pharmaceutical Assays
APPLICATIONS OF IR-SPECTROSCOPY IN PHARMACEUTICAL ASSAYS
1. APPLICATIONS OF IR-SPECTROSCOPY IN THE ANALYSIS OF PHARMACEUTICAL SUBSTANCES
A host of pharmaceutical substances can be identified and
critically examined with the help of infra-red spectroscopy. Hence, the latest
versions of British Pharmacopoeia (BP) and United States Pharmaco-poeia (USP)
contain the complete IR-spectrum of such pure pharmaceutical substances that
are essentially included in the respective official
compendium. These authentic IR-spectra are profusely used in many
well-equipped Quality Assurance Laboratories in checking the purity of
commercially available drugs before employing them in various formulations.
Following is the detailed procedure laid out in the
Pharmacopoeia of India (IP) for the preparation of KBr-disc or KCl-disc :
Procedure : Triturate about 1 mg of the
pharmaceutical substance with approximately 300 mg of dry, finely powdered KBr or KCl of spectroscopic grade, as directed.
Grind the mixture thoroughly, spread it uniformly in a suitable die and
compress under vacuum at a pressure of about 10 t in–2. Mount the
resultant disc in a suitable holder in the spectrophotometer and obtain the
IR-spectrum.
Precautions : The following precautions may
be observed carefully :
(i) Several
factors e.g. excessive or
insufficient grinding, absorption of moisture or other impurities in the halide
carrier, may ultimately result in the formation of unsatisfactory discs,
(ii) Unless its
preparation presents certain specific difficulties a disc should be rejected if
visual in-spection shows lack of uniformity, or if the transmittance at about
2000 cm–1 (5 μ m) in the absence of a
specific absorption band is less than 75% without compensation, and
(iii) If the
other ingredients of tablets, injections or other dosage forms are not
completely removed from the substance being examined, they may contribute to the
spectrum.
Example : The infrared absorption
spectrum of the following pharmaceutical substances do exhibit maxima
which are only at the same wavelengths as, and have similar relative
intensities to those in the spectrum of the corresponding reference samples,
namely :
Ampicillin sodium ; Amylobarbitone ; Betamethasone ;
Betamethasone valerate ; Carbenicillin disodium ; Chloroquine phosphate ;
Chloroquine sulphate ; Cemetidine ; Clofazimine ; Clofibrate ; Clonidine
hydrochloride ; Cloxacilline sodium ; Colchicine Cyclophosphamide ;
Cyproheptadine hydrochloride ; Dexamethasone ; Activated dimethicone ;
Diphenylpyraline hydrochloride ; Erythromycin estolate ; Ethambutol
hydrochloride ; Ethirylestradiol ; Ethiosuximide ; Fludrocortisone acetate ;
Fluphenazine hydrochloride ; Iburprofen ; Diluted isosorbide dinitrate ;
Lincomycin hydrochloride ; Mebendazole ; Metoformin hydrochloride ;
Methdilazine hydrochloride ; Methotrexate ; Nalidixic acid ; Nandrolone
decanoate ; Nandrolone phenylpropionate ; Niclosamide ; Nitrofurantoin ;
Nitrofurazone ; Norethisterone ; Oxprenolol hydrochloride ; Pentazocine
hydrochloride ; Pentolamine hydrochloride ; Phentolamine mesylate ; Primidone ;
Prochlorperazine mesylate ; Proguanil hydrochlorde ; Pyrazinamide ;
Pyrimethamine ; Rifampicin ; Spironolactone ; Stilbosterol diphosphate ;
Sulphadimethoxine ; Sulphalene ; Sulphamethizole ; Testosterone propionate ;
Thiabendazole ; Trifluoperazine hydrochloride ; Triflupromazine hydrochloride.
2. APPLICATIONS OF IR-SPECTROSCOPY IN THE ANALYSIS OF PHARMACEUTICAL DOSAGE FORMS
A number of pharmaceutical dosage forms can be assayed
conveniently with the help of IR-spectroscopy. A few typical examples are
enumerated below for ready reference, namely :
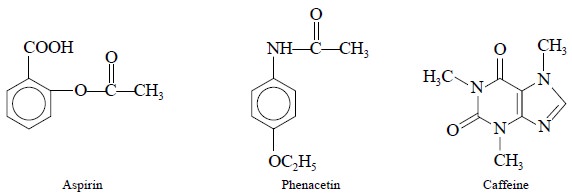
2.1. Determination of Aspirin, Phenacetin and Caffeine in Tablets
Theory : The quantitation is solely
based on the intensities of the carbonyl bands at 1764, 1511 and 1665 cm–1 for aspirin,
phenacetin and caffeine respectively.
Materials Required : APC-Tablets ; Chloroform ;
Procedure : The drug contents of an
appropriate number of tablets are directly extracted into chloro-form, filtered
if necessary so as to remove the insoluble tablet components, and the final
concentration of chloroform solution is made in such a way so that it should contain
: 90 mg ml–1 of aspirin ; 64 mg ml–1 of phenacetin, and
134 mg ml–1 of caffeine. The IR-spectrum is now recorded in a 0.1 mm
NaCl-cell between 1400-2000 cm–1
2.2. Determination of Codeine Phosphate in Tablets
Codeine phosphate was duly extracted into CS2
and quantitatively determined by measuring its ab-sorption at 942 cm–1.
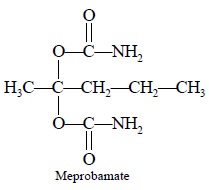
2.3. Determination of Meprobamate in Tablets
Maynard (1960) carried out the analysis of meprobamate by
dissolving it in chloroform (spectroscopic grade) and subsequently determining
the intensity of the amide carbonyl band  at 1582 cm–1. Later Shearken (1968) adopted a modified method of
assay by using chloroform as an extracting medium, but instead of the carbonyl
band measured the N—H stretching band at 3436 cm–1. However, this
particular method essentially requires the complete removal of both water and
ethanol ; the latter is present in CHCl3 as a stabilizer which is
required to be eliminated completely to avoid interference from O—H stretching
bands. To achieve this objective activated alumina columns have been used
extensively. However, Zappala and Post(1977) got rid of the interferences
occurring at lower frequencies by measuring meprobamates by employing the
primary amine combination band at 5107 cm–1 in the near IR region.
at 1582 cm–1. Later Shearken (1968) adopted a modified method of
assay by using chloroform as an extracting medium, but instead of the carbonyl
band measured the N—H stretching band at 3436 cm–1. However, this
particular method essentially requires the complete removal of both water and
ethanol ; the latter is present in CHCl3 as a stabilizer which is
required to be eliminated completely to avoid interference from O—H stretching
bands. To achieve this objective activated alumina columns have been used
extensively. However, Zappala and Post(1977) got rid of the interferences
occurring at lower frequencies by measuring meprobamates by employing the
primary amine combination band at 5107 cm–1 in the near IR region.
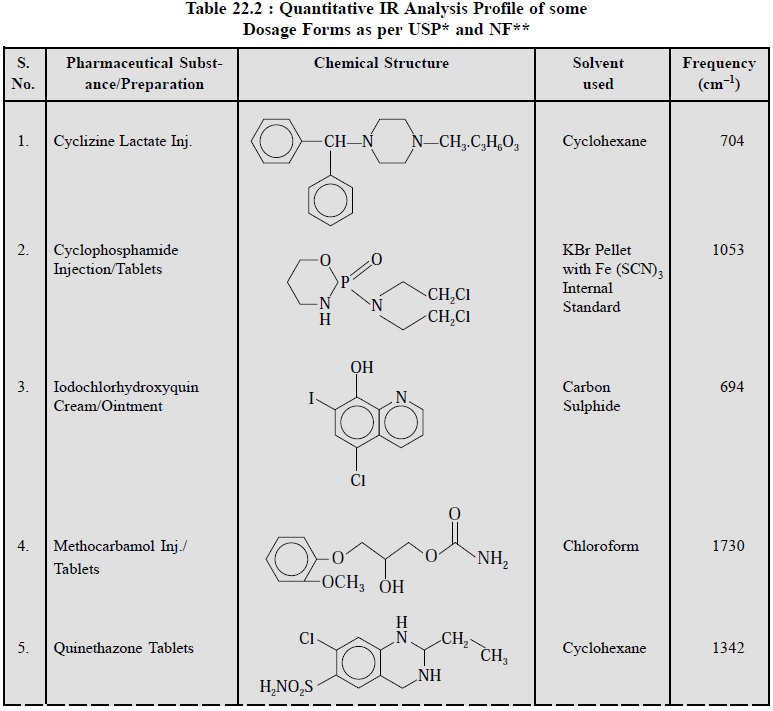
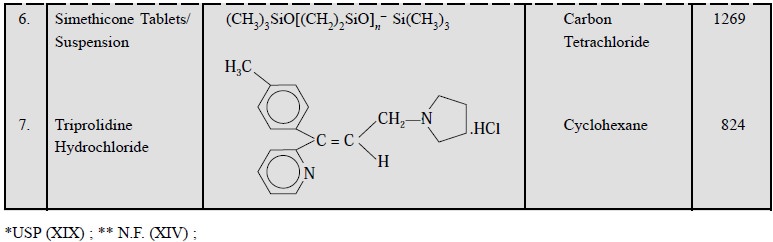
2.4. Cognate Assays
The USP (XIX) and NF (XIV) have described the assays of
various pharmaceutical dosage forms in appropriate solvent at different
frequencies (cm–1). A few typical examples are given in Table 22.2.
Related Topics