Chapter: Pharmaceutical Drug Analysis: Infrared Spectrophotometry
Infrared Spectrophotometry: Instrumentation
INSTRUMENTATION
The infrared spectrophotometers are based on either
single monochromation or double monochromation :
(a)
Single-Monochromator Infrared Spectrophotometer, and
(b) Double-Monochromator
Infrared Sepctrophotometer.
The optical diagrams, components used and their modes of
operation shall be discussed briefly in this context under different heads.
1. SINGLE MONOCHROMATOR INFRARED SPECTROPHOTOMETERS
The important features of an infrared spectrophotometer
are as follows :
(i) Infrared
sources,
(ii)
Monochromators,
(iii)
Detectors, and
(iv) Mode of
Operation.
1.1. Infrared Sources
The most common infrared sources are electrically heated
rods of the following types :
(a) Sintered
mixtures of the oxides of Zirconium (Zr), Yttrium (Y), Erbium (Er) etc., also
known as
‘Nernst Glower’,
(b) Silicon
Carbide ‘Globar’, and
(c) Various
ceramic (clay) materials.
It is quite evident that the infrared output from all
these different sources invariably varies in intensity over a definite
frequency range, therefore, a compensating variable slit is usually programmed
to operate in unison with the scanning over the individual frequencies.
1.2. Monochromators
Three types of substances are
normally employed as monochromators, namely :
(i) Metal Halide Prisms : Various metal
halide prisms, such as : KBr (12-25 μ m), LiF (0.2-6 μ m) and CeBr (15-38 μ m) have been used earlier, but they have become more or
less obsolescent nowadays.
(ii) NaCl Prism (2-15 μ m) : Sodium chloride prism are of
use for the whole of the region from 4000-650 cm–1. First, it offers
low resolution at 4000-2500 cm–1, and secondly, because of its
hygroscopic nature the optics have got to be protected at 20 °C above the
ambient temperature.
(iii) Gratings : In general, gratings are
commonly employed in the design of the instruments and offer better resolution
at higher frequency than the prisms. They offer much better resolution at low
frequency, viz., typical rulings are
240 lines per nm for the 4000-1500 cm–1 region and 120 lines per nm
for the 1500-650 cm–1 region.
1.3. Detectors
There are ion all three
different types of detectors that are used in the infrared region :
(a) Thermocouples (or Thermopiles) : The
underlying principle of a thermocouple is that if two dissimilar metal wires
are joined head to tail, then a difference in temperature between head and tail
causes a current to flow in the wires. In the infrared spectrophotometer this
current shall be directly proportional to the intensity of radiation falling on
the thermocouple. Hence, the thermo-couples are invariably employed in the
infrared region, and to help in the complete absorption of ‘available energy’
the ‘hot’ junction or receiver is normally blackened.
(b) Golay Detector : In this specific
instance the absorption of infrared radiation affords expansion of an inert gas
in a cell-chamber. One wall of the cell-chamber is provided with a flexible
mirror and the resulting distortion alters the intensity of illumination
falling on a photocell from a reflected beam of light. Thus, the current from
the photocell is directly proportional to the incident radiation.
(c) Bolometers : These are based on the
principle that make use of the increase in resistance of a metal with increase
in temperature. For instance, when the two platinum foils are appropriately
incorporated into a Wheatstone bridge, and radiation is allowed to fall on the
foil, a change in the resistance is observed ultimately. This causes an
out-of-balance current that is directly propor-tional to the incidental
radiation. Just like the thermocouples, they are used in the infrared region
1.4. Mode of Operation
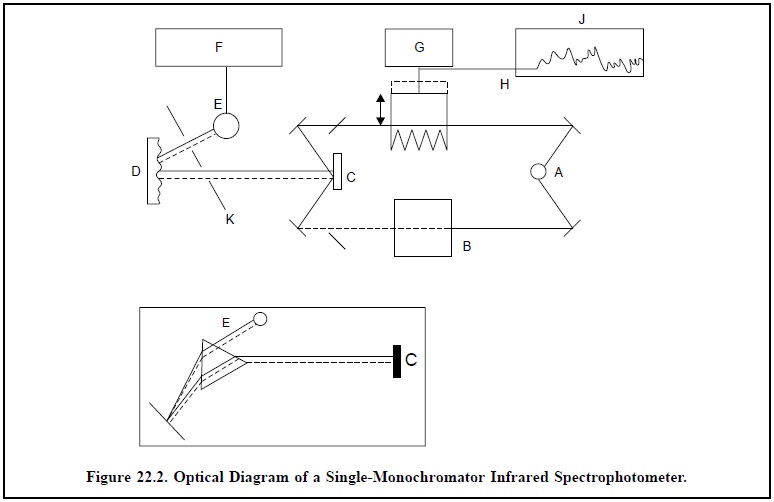
The schematic layout of a single-monochromator infrared
spectrophotometer has been duly depicted in Figure 22.2.

The various vital components of Figure 22.2 are as
follows :
A = Infrared source,
B = Sample beam,
C = Chopper—a rotating segmented mirror,
D = Monochromator grating,
E = Detector thermopile,
F = Amplifier,
G= Servo-motor,
H = An optical Wedge,
I= Prism,
J= Ink-pen recorder, and
K= Slits.
The sequential steps observed in the mode of operation
are as stated below :
(i) The light
from infrared source A is split equally into two beams ; one of which B is made
to pass through the sample i.e., the
sample beam while the other serves as reference beam.
The main objective of such a double beam operation is to
measure the difference in intensities between the two beams at each wave
length.
(ii) The two
beams are subsequently reflected on a rotating segmented mirror called chopper
C. The chopper rotating ≈ 10 times per second helps the
sample beam and the reference beam to be reflected alternatively to the
monochromator grating D.
(iii) Thus, the
grating rotates slowly and transmits individual frequencies to the detector
thermopile (E), that consequently converts the infrared (thermal) energy to the
corresponding electrical energy.
(iv) When a
sample has absorbed a certain quantum of light of specific frequency the
detector shall be receiving alternatively from the chopper an intense beam (due
to reference beam) and a relatively weak beam (due to sample beam). It will
generate a pulsating or alternating current (AC) flowing from the detector to
the amplifier F.
(v) This
out-of-balance signal received by the amplifier, is coupled to a small
servo-motor G, that drives an optical wedge (H) into the reference beam until
the detector receives light of equal intensity from sample and reference beams.
(vi) The
slightest movement of the wedge (or attenuator) is further coupled to a ink-pen
recorder J, so that movement of the former, both ‘in’ and ‘out’ of the
reference beam, is adequately recorded on the printed chart at various
absorption bands.
This specific type of the ‘double-beam optical-null recording spectrophotometer’ is termed so
because it critically balances out by the help of optical means the
differential between the two beams.
The ‘inset diagram’ in Figure 22.2 shows the use of a ‘prism’ in place of the ‘grating’. However, underlying
principle being identical, a rotating mirror affords the scanning of individual
frequencies.
2. DOUBLE-MONOCHROMATOR INFRARED SPECTROPHOTOMETER
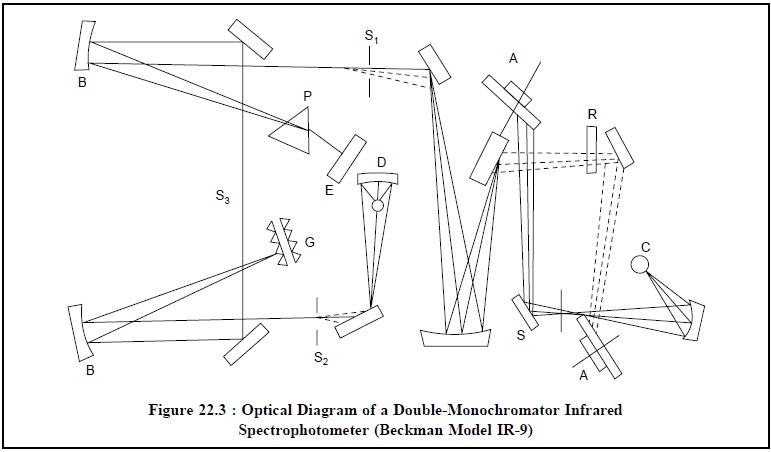
The schematic optical diagram of a double-beam infrared
spectrophotometer has been shown in Fig-ure 22.3 as per Beckman Model IR-9.

The various components of a double-monochromator infrared
spectrophotometer shown in Figure 22.3 are as follows below :
A = Rotating mirror,
B = Collimating mirror,
C = Infrared source,
S = Sample beam,
R = Reference beam,
D = Detector,
S1 = Entrance, slit,
S2 = Exit slit,
S3 = Intermediate slit,
E = Littrow mirror,
G = Monochromator Gratings, and
P = Prism.
The various steps that may be followed sequentially to
operate a double-monochromator infrared spectrophotometer are described below :
(i) The light
from the infrared source C is made to split into two beams one of which passes
through the sample (i.e., the sample
beam) while the other caters as the reference beam. This sort of dou-ble-beam
arrangement facilitates in measuring difference in intensities between the two beams at each wavelength,
(ii) In this
instance two monochromators have been employed in series with an intermediate
slit (S3) as shown in Figure 22.3,
(iii) The
optical train affords as much as twice the dispersion and the ultimate
resolution is fairly comparable to any single-monochromator instrument (Figure
22.2),
(iv) All stray
radiant energy is virtually eliminated,
(v) In Figure
22.3, (Beckman Model IR-9) one of the two prism monochromators has been
replaced with a dual grating, and
(vi) Finally,
the detector picks up light of equal intensity from sample and reference beams.
1.5. Experimental Profile of Infrared Spectroscopy : Quantitative Analysis
In usual practice, there are two methods that are frequently employed for the determination of
the transmittance ratio in quantitative analysis namely :
(a) Emperical
ratio method, and
(b) Base-line
method.
The above two
methods shall be discussed briefly with the help of certain typical examples as
detailed below :
1.5.1. Emperical Ratio Method
This particular method is often employed in a situation
where the absorption bands of the analyte are found to be very close to those
of the main constituent or the internal standard.
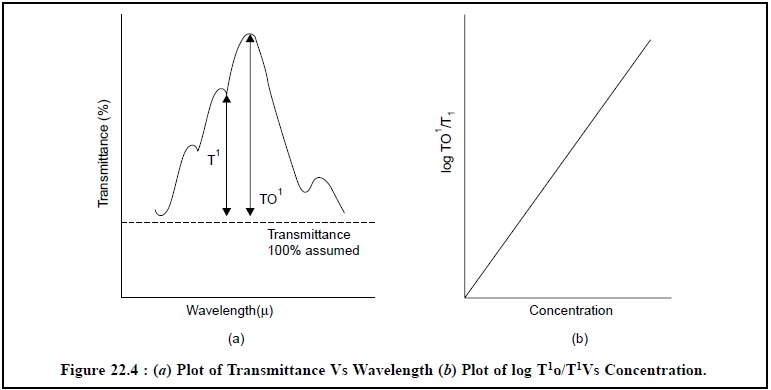
The quantitative analysis of pharmaceutical substances
may be achieved by emperical-ratio method either by plotting percentage
transmittance against wavelength or by plotting the log T1o/T1
against concen-tration as illustrated in Figure 22.4.

1.5.2. Base-Line Method
It essentially involves the selection of an absorption
band of an analyte which does not remain very close to the bands of other
constituents present in the matrix.
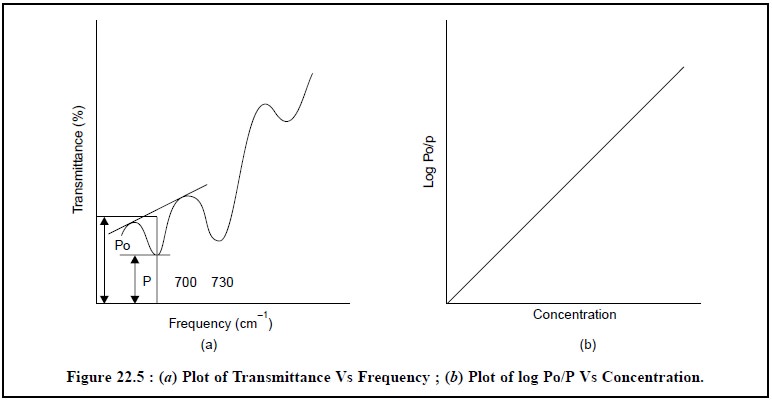
Figure 22.5 depicts the absorption bands of the sodium
salt of Penicillin G at 703 cm–1.

The value of the incident radiant energy Po may be
achieved by drawing a straight line tangent to the spectral absorption curve at
the position of the analyte’s absorption band. Consequently the transmittance P
is usually measured at the point of maximum absorption. Finally, the value of
log Po/P is plotted against the concentration as shown in Figure 22.5.
It is, however, pertinent to mention here that the
application of both emperical ratio method and base-line method help in
eliminating to a great extent the errors caused due to changes in source
intensity and adjustment of the optical system.
1.6. Determination of the Absorption Spectrum of a Solid Compound (or a Pharmaceu-tical Substance)
The determination of the absorption spectrum of a solid
pharmaceutical substance is invariably ac-complished by any one of the two following techniques namely :
(a) Mull
Technique, and
(b) Potassium
Bromide Disc Technique.
These two
different techniques shall be described below :
1.6.1. Mull Technique
Procedure : Take about 15-20 mg of sample
in a previously cleaned small agate mortar and powder it thoroughly (about 200 mesh). Add to it 2 drops of purified
paraffin (commonly known as Nujol) or any other suitable mulling liquid and
continue the trituration until a very smooth paste of uniform consistency is
achieved. Now, transfer the slurry to a sodium chloride window, placing it
carefully into the cavity made by the spacer. Consequently, place the other
window on top and thus assemble the cell. With the help of a clean piece of
tissue-paper wipe out the excess paste that has squeezed out from the cell
windows. Finally, intro-duce the cell in the respective cell-compartment.
Salient Features : The salient features of Mull
Technique are as follows :
(i) Particle
size of the sample has got to be reduced below 200 mesh or 3 μ m so as to avoid scattering of radiation thereby causing
poor absorption spectrum.
(ii) Hydrogen
bonding and crystal forces usually influence the trace obtained.
(iii) Paraffin
itself gives rise to strong band either at 1460-1380 cm–1 or at
2820-2850 cm–1.
1.6.2. Potassium Bromide Disc
Technique
Procedure : For a window of diameter 1.3
cm, take 100 mg of spectroscopic grade KBr in a previ-ously cleaned agate
pestle and mortar and grind it thoroughly with 0.05-0.5 mg of the sample. Now,
carefully place the sample mixture into the pressing chamber of the mould in
such a manner that it is held between the polished surfaces of the bottom and
top pressing dies. Subsequently, attach the chamber to the vacuum line and
switch-on the vacuum pump ; initially applying a slight negative pressure so as
to compact the powder and then gradually increasing it to ≤ 15 mm Hg for 30 seconds. Finally, enhance the pressing
force to 100,000 lb/in2 or 10-12 tons/in2 for a period of
1-2 minutes. Carefully, release the pressure and dismantle the dies. Now,
remove the window from the mould and keep it in position onto the sample
holder.
Salient Features : The salient features of
KBr-disc technique are stated below :
(i) There
exists a possibility of interaction between vibrations of the sample and the
potassium halide lattice,
(ii) It is
considered to be the most suitable method for other screening of very minute
quantities of substances being eluted from the columns in Gas Liquid
Chromatography (GLC). In actual prac-tice, about 300 mg of the spectroscopic
grade KBr is placed in a short column immediately after the detector.
Consequently, the solid is powdered, pressed into a disc in the normal
procedure and ultimately the absorption spectrum of the trapped substance is
studied,
(iii) It enjoys
the advantage of producing spectra absolutely free from any solvent peaks
(unlike Mull Technique) and hence it is employed extensively in routine
analysis.
Internal Standard for KBr-Disc
Technique : In
quantitative analysis it is essential to examine absolutely uniform discs of identical weights. To achieve this,
known weights of both KBr and analyte are required in the preparation of the
KBr-disc and finally from the absorption data a calibration-curve may be
obtained. In this process, it is a must to weigh the discs and also to measure
their thickness at different points on their surface with the help of a dual
micrometer. In order to overcome this tedious process of measuring disc
thickness carefully the use of an internal standard has been introduced.
Potassium thiocyanate (KSCN) is considered to be the choicest internal standard. In usual
prac-tice, it must be preground, dried and subsequently reground, and used at a
concentration of 0.2% (w/w) along with the dried spectroscopic grade KBr. The
mixture of KBr-KSCN is stored over P2O5.
Procedure : A standard calibration curve
is plotted by thoroughly mixing together about 10% (w/w) of the analyte with the KBr-KSCN mixture and then grinding the
same intimately. Now, the ratio of the thiocyanate absorption at 2125 cm–1
to a selected band absorption of the analyte is plotted against the percent
concentration of the sample. Likewise, an identical disc is prepared with the
unknown sample and the same KBr-KSCN mixture. Finally, its absorbance ratio is
determined and the concentration (of unknown sample) is read off directly from
the standard calibration curve.
1.7. Calibration of Infrared Spectrophotometers
The wavelength (or wave number) scale calibration of
infrared spectrophotometers is usually carried out with the aid of a strip of
polystyrene film fixed on a frame. It consists of several sharp absorption
bands, the wavelengths of which are known accurately and precisely. Basically,
all IR-spectrophotometers need to be calibrated periodically as per the
specific instructions so as to ascertain their accuracy and precision.
Related Topics