Chapter: Medical Physiology: Cardiac Output, Venous Return, and Their Regulation
Analysis of Cardiac Output and Right Atrial Pressure, Using Simultaneous Cardiac Output and Venous Return Curves
Analysis of Cardiac Output and Right Atrial Pressure, Using Simultaneous Cardiac Output and Venous Return Curves
In the complete circulation, the heart and the systemic circulation must operate together. This means that (1) the venous return from the systemic circulation must equal the cardiac output from the heart and (2) the right atrial pressure is the same for both the heart and the systemic circulation.
Therefore, one can predict the cardiac output and right atrial pressure in the following way: (1) Determine the momentary pumping ability of the heart and depict this in the form of a cardiac output curve; (2) determine the momentary state of flow from the systemic circula-tion into the heart and depict this in the form of a venous return curve; and (3) “equate” these curves against each other, as shown in Figure 20–14.
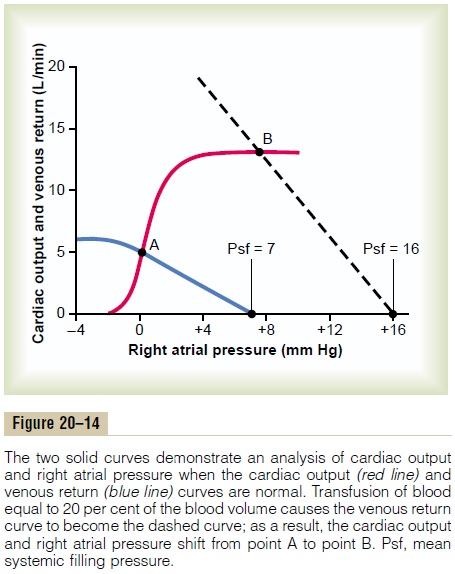
Two curves in the figure depict the normal cardiacoutput curve (red line) and the normal venous return curve (blue line). There is only one point on the graph,point A, at which the venous return equals the cardiac output and at which the right atrial pressure is the same for both the heart and the systemic circulation. There-fore, in the normal circulation, the right atrial pressure, cardiac output, and venous return are all depicted by point A, called the equilibrium point, giving a normal value for cardiac output of 5 liters per minute and a right atrial pressure of 0 mm Hg .
Effect of Increased Blood Volume on Cardiac Output. A suddenincrease in blood volume of about 20 per cent increases the cardiac output to about 2.5 to 3 times normal. An analysis of this effect is shown in Figure 20–14. Imme-diately on infusing the large quantity of extra blood, the increased filling of the system causes the mean systemic filling pressure (Psf) to increase to 16 mm Hg, which shifts the venous return curve to the right. At the same time, the increased blood volume distends the blood vessels, thus reducing their resistance and thereby reducing the resistance to venous return, which rotates the curve upward. As a result of these two effects, the venous return curve of Figure 20–14 is shifted to the right. This new curve equates with the cardiac output curve at point B, showing that the cardiac output and venous return increase 2.5 to 3 times, and that the right atrial pressure rises to about +8 mm Hg.
Further Compensatory Effects Initiated in Response to Increased Blood Volume. The greatly increased cardiac outputcaused by increased blood volume lasts for only a few minutes because several compensatory effects immedi-ately begin to occur: (1) The increased cardiac output increases the capillary pressure so thatfluid begins totransude out of the capillaries into the tissues, thereby returning the blood volume toward normal. (2) The increased pressure in the veins causes the veins to continue distending gradually by the mechanism called stress-relaxation, especially causing the venous bloodreservoirs, such as the liver and spleen, to distend, thus reducing the mean systemic pressure. (3) The excessblood flow through the peripheral tissues causes autoregulatory increase in the peripheral resistance, thus increasing the resistance to venous return. These factors cause the mean systemic filling pressure to return back toward normal and the resistance vessels of the systemic circulation to constrict. Therefore, gradu-ally, over a period of 10 to 40 minutes, the cardiac output returns almost to normal.
Effect of Sympathetic Stimulation on Cardiac Output. Sympa-thetic stimulation affects both the heart and the sys-temic circulation: (1) It makes the heart a stronger pump. (2) In the systemic circulation, it increases the meansystemic filling pressure because of contraction ofthe peripheral vessels—especially the veins—and it increases the resistance to venous return.
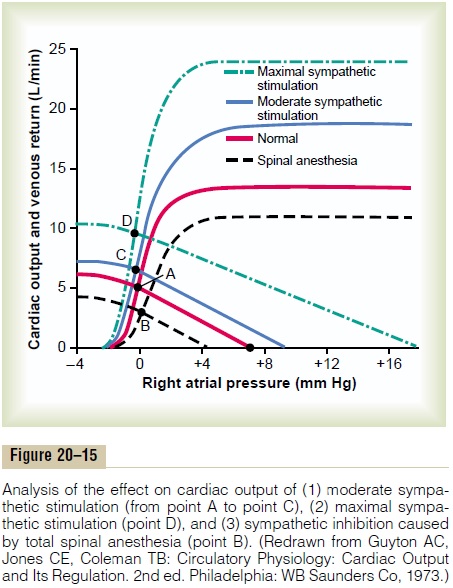
In Figure 20–15, the normal cardiac output and venous return curves are depicted; these equate with each other at point A, which represents a normal venous return and cardiac output of 5 L/min and a right atrial pressure of 0 min Hg. Note in the figure that maximal sympathetic stimulation (green curves) increases the mean systemic filling pressure to 17 mm Hg (depicted by the point at which the venous return curve reaches the zero venous return level). And the sympathetic stim-ulation also increases pumping effectiveness of the heart by nearly 100 per cent. As a result, the cardiac output rises from the normal value at equilibrium point A to about double normal at equilibrium point D—and yet the right atrial pressure hardly changes. Thus, differ-ent degrees of sympathetic stimulation can increase the cardiac output progressively to about twice normal forshort periods of time, until other compensatory effectsoccur within seconds or minutes.
Effect of Sympathetic Inhibition on Cardiac Output. The sym-pathetic nervous system can be blocked by inducing total spinal anesthesia or by using some drug, such as hexamethonium, that blocks transmission of nervesignals through the autonomic ganglia. The lowermost curves in Figure 20–15 show the effect of sympathetic inhibition caused by total spinal anesthesia, demon-strating that (1) the mean systemic filling pressure fallsto about 4 mm Hg and (2) the effectiveness of the heart as a pump decreases to about 80 per cent of normal. Thecardiac output falls from point A to point B, which is a decrease to about 60 per cent of normal.
Effect of Opening a Large Arteriovenous Fistula. Figure 20–16shows various stages of circulatory changes that occur after opening a large arteriovenous fistula, that is, after making an opening directly between a large artery and a large vein.
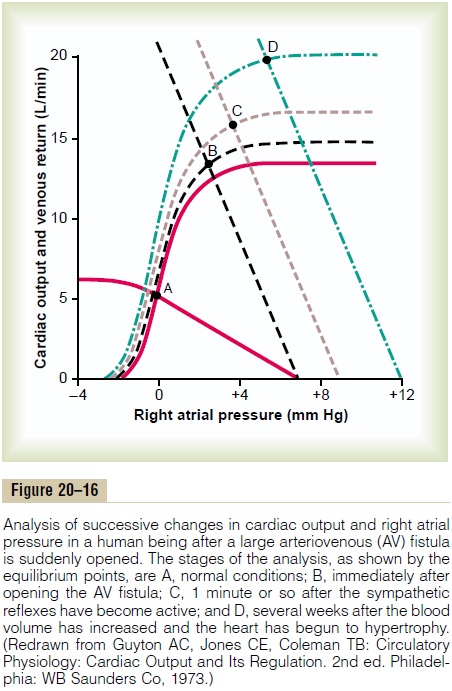
1.The two red curves crossing at point A show the normal condition.
2.The curves crossing at point B show the circulatory condition immediately after opening the largefistula. The principal effects are (1) a sudden andprecipitous rotation of the venous return curve upward caused by the large decrease in resistance tovenous returnwhen blood is allowed toflow withalmost no impediment directly from the large arteries into the venous system, bypassing most of the resistance elements of the peripheral circulation, and (2) a slight increase in the level ofthe cardiac output curve because opening thefistuladecreases the peripheral resistance and allows an acute fall in arterial pressure against which the heart can pump more easily. The net result, depicted by point B, is an increase in cardiac outputfrom 5 L/min up to 13 L/min and an increase in right atrial pressure to about +3 mm Hg.
3. Point C represents the effects about 1 minute later, after the sympathetic nerve reflexes have restored the arterial pressure almost to normal and caused two other effects: (1) an increase in the mean systemic filling pressure (because of constriction of all veins and arteries) from 7 to 9 mm Hg, thus shifting the venous return curve 2 mm Hg to the right, and (2) further elevation of the cardiac output curve because of sympathetic nervous excitation of the heart. The cardiac output now rises to almost 16 L/min, and the right atrial pressure to about 4 mm Hg.
4. Point D shows the effect after several more weeks. By this time, the blood volume has increased because the slight reduction in arterial pressure and the sympathetic stimulation have both reduced kidney output of urine. The mean systemic filling pressure has now risen to +12 mm Hg, shifting the venous return curve another 3 mm Hg to the right. Also, the prolonged increased workload on the heart has caused the heart muscle to hypertrophy slightly, raising the level of the cardiac output curve still further. Therefore, point D shows a cardiac output now of almost 20 L/min and a right atrial pressure of about 6 mm Hg.
Other Analyses of Cardiac Output Regulation. Analysis of cardiac output regulation during exercise is presented, and analyses of cardiac output regulation at various stages of congestive heart failure are shown.
Related Topics