Chapter: 12th Statistics : Chapter 4 : Correlation Analysis
Yule’s Coefficient of Association
YULE’S COEFFICIENT OF ASSOCIATION
This measure is used to know the existence of relationship between
the two attributes A and B (binary complementary variables).
Examples of attributes are drinking, smoking, blindness, honesty, etc.

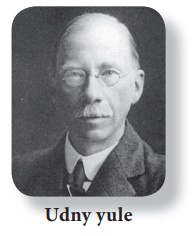
Udny Yule (1871 – 1951), was a British statistician. He was educated at Winchester College and at University College London. After a year dong research in experimental physics, he returned to University College in 1893 to work as a demonstrator for Karl Pearson. Pearson was beginning to work in statistics and Yule followed him into this new field. Yule was a prolific writer, and was active in Royal Statistical Society and received its Guy Medal in Gold in 1911, and served as its President in 1924–26.The concept of Association is due to him.
Coefficient of Association
Yule’s Coefficient of Association measures the strength and
direction of association.
“Association” means that the attributes have some
degree of agreement.
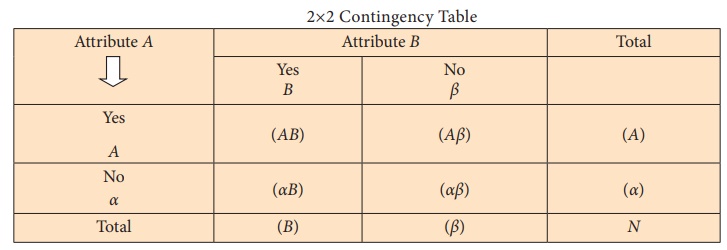
2√ó2 Contingency Table

Yule’s coefficient: Q = 
Note 1: The usage of the symbol α is not to be confused
with level of significance.
Note 2: (AB): Number with attributes AB etc.
This coefficient ranges from –1 to +1. The values between –1 and 0
indicate inverse relationship (association) between the attributes. The values
between 0 and +1 indicate direct relationship (association) between the
attributes.
Example 4.7
Out of 1800 candidates appeared for a competitive examination 625
were successful; 300 had attended a coaching class and of these 180 came out
successful. Test for the association of attributes attending the coaching class
and success in the examination.
Solution:
N = 1800
A: Success in examination
α: No success in examination
B: Attended the coaching class
β: Not attended the coaching class
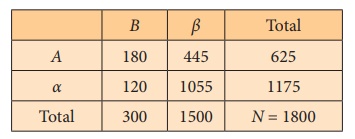
(A) = 625, (B) = 300, (AB) = 180

Yule’s coefficient: Q = [ ( AB )(αβ ) − ( Aβ )(α B) ]
/ [ ( AB )(αβ ) + ( Aβ )(α B) ]
= [180 √ó 1055 ‚àí 445 √ó120] / [180 √ó 1055 + 445 √ó120]
= [189900 – 53400]
/ [189900 + 53400]
= 136500
/ 243300
= 0.561> 0
Interpretation: There is a positive association between success
in examination and attending coaching classes. Coaching class is useful
for success in examination.
Remark: Consistency in the data using contingency table may be
found as under.
Construct a 2 √ó 2 contingency table for the given information. If
at least one of the cell frequencies is negative then there is inconsistency in
the given data.
Example 4.8
Verify whether the given data: N = 100, (A)
= 75, (B) = 60 and (AB) = 15 is
consistent.
Solution:
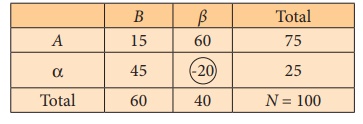
The given information is presented in the following contingency
table.

Notice that (αβ) = −20
Interpretation: Since one of the cell frequencies is negative,
the given data is “Inconsistent”.
Related Topics