Correlation Analysis - Introduction | 12th Statistics : Chapter 4 : Correlation Analysis
Chapter: 12th Statistics : Chapter 4 : Correlation Analysis
Introduction
CORRELATION ANALYSIS
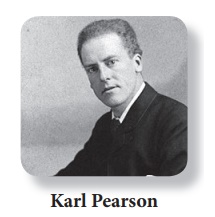
Karl Pearson (1857-1936) was a English Mathematician and Biostatistician. He
founded the world’s first university statistics department at University
College, London in 1911. The linear correlation coefficient is also called
Pearson product moment correlation coefficent. It was developed by Karl Pearson
with a related idea by Francis Galton (see Regression analysis - for Galton’s
contribution). It is the first of the correlation measures developed and
commonly used.

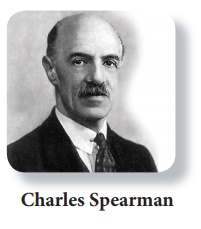
Charles Edward Spearman (1863-1945) was an English psychologist and ,after
serving 15 years in Army he joined to study PhD in Experimental Psychology and
obtained his degree in 1906. Spearman was strongly influenced by the work of
Galton and developed rank correlation in 1904.He also pioneered factor analysis
in statistics.

“When the relationship is of a quantitative nature, the
appropriate statistical tool for discovering the existence of relation and
measuring the intensity of relationship is known as correlation”
—CROXTON AND COWDEN
LEARNING OBJECTIVES
The student will be able to
·
learn the meaning, definition and the uses of correlation.
identify the types of correlation.
·
understand correlation coefficient for different types of
measurement scales. differentiate different types of correlation using scatter
diagram.
·
calculate Karl Pearson’s coefficient of correlation, Spearman’s
rank correlation coefficient and Yule’s coefficient of association.
·
interpret the given data with the help of coefficient of
correlation.
Introduction
“Figure as far as you can, then add judgment”
The statistical techniques discussed so far are for only one
variable. In many research situations one has to consider two variables
simultaneously to know whether these two variables are related
linearly. If so, what type of relationship that exists between them. This leads
to bivariate (two variables) data analysis namely correlation analysis. If two
quantities vary in such a way that movements ( upward or downward) in one are
accompanied by the movements( upward or downward) in the other, these
quantities are said to be co-related or correlated.
The correlation concept will help to answer the following types of
questions.
·
Whether study time in hours is related with marks scored in the
examination?
·
Is it worth spending on advertisement for the promotion of sales?
·
Whether a woman’s age and her systolic blood pressure are related?
·
Is age of husband and age of wife related?
·
Whether price of a commodity and demand related?
·
Is there any relationship between rainfall and production of rice?
Related Topics