Merits and Demerits | Correlation Analysis - Scatter Diagram | 12th Statistics : Chapter 4 : Correlation Analysis
Chapter: 12th Statistics : Chapter 4 : Correlation Analysis
Scatter Diagram
SCATTER DIAGRAM
A scatter diagram is the simplest way of the diagrammatic
representation of bivariate data. One variable is represented along the X-axis
and the other variable is represented along the Y-axis. The pair of
points are plotted on the two dimensional graph. The diagram of points so
obtained is known as scatter diagram. The direction of flow of points shows the
type of correlation that exists between the two given variables.
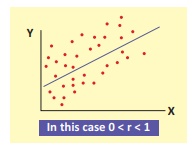
1) Positive correlation
If the plotted points in the plane form a band and they show the
rising trend from the lower left hand corner to the upper right hand corner,
the two variables are positively correlated.
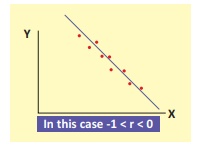
2) Negative correlation
If the plotted points in the plane form a band and they show the
falling trend from the upper left hand corner to the lower right hand corner,
the two variables are negatively correlated.
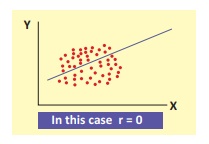
3) Uncorrelated
If the plotted points spread over in the plane then the two
variables are uncorrelated.
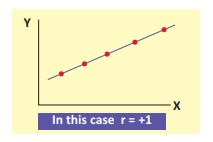
4) Perfect positive correlation
If all the plotted points lie on a straight line from lower left
hand corner to the upper right hand corner then the two variables have perfect
positive correlation.
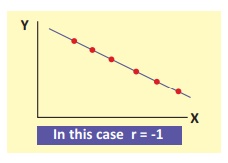
5) Perfect Negative correlation
If all the plotted points lie on a straight line falling from
upper left hand corner to lower right hand corner, the two variables have
perfect negative correlation.
Merits and Demerits of scatter diagram
Merits
·
It is a simple and non-mathematical method of studying correlation
between the variables.
·
It is not influenced by the extreme items
·
It is the first step in investigating the relationship between two
variables.
·
It gives a rough idea at a glance whether there is a positive
correlation, negative correlation or uncorrelated.
Demerits
·
We get an idea about the direction of correlation but we cannot
establish the exact strength of correlation between the variables.
·
No mathematical formula is involved.
Related Topics