Geography - Wind Rose Diagram | 11th Geography : Chapter 10 : Representation of Relief Features and Climatic Data
Chapter: 11th Geography : Chapter 10 : Representation of Relief Features and Climatic Data
Wind Rose Diagram
Wind
Rose Diagram
Wind rose diagrams show wind data for
a particular station. It is in the form of star shape so it is also called star
diagram. Wind rose diagram is used to depict the wind direction and average
frequency for a particular site. Wind data are generally collected at 10 m
above ground and if required at various
They
can be prepared for month-wise, season-wise or yearly as needed. Wind velocity
can also be shown within this diagram. Sometimes they even include air
temperature information. Wind rose diagram is vital for constructing runways in
airports. The run way is generally oriented towards the prevailing wind. Wind
rose diagram is an essential inclusion in pilots chart and sailing charts.
Architects and builders need to analyse the wind rose diagram for proper
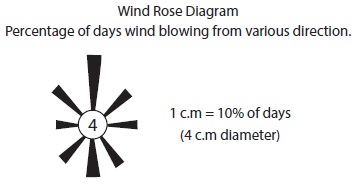
ventilation. The concept of simple wind rose diagram is given below.
Exercise 4
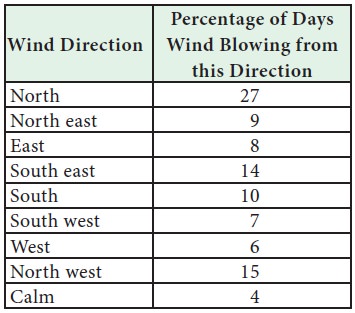
Draw a wind rose diagram for the
following data.
Step 1:
Select a suitable
scale (in this case 1 cm = 10%)
Step 2:
Draw a circle to
represent the calm for this scale. (Draw a circle with 0.4 cm radius)
Step 3:
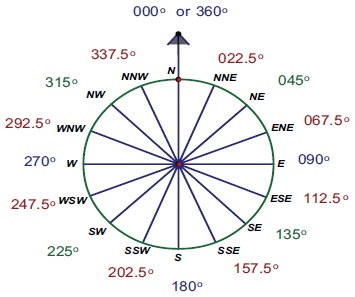
Mark the directions
in this circle using a protractor as shown in the figure. (considering 0° for north,
45° for NE, 90° for East, 135° for South east, 180° for South, 225° for South
west, 270° for West and 315° for North west.
Step 4:
Draw a bar with
suitable with equal to the length of 2.7 cm in northern direction, 0.9 cm in the north
eastern direction and so on to complete the diagram.
Step 5:
Mention the calm in
the centre, mention the scale chosen to draw the diagram and name the directions as
instructed above.


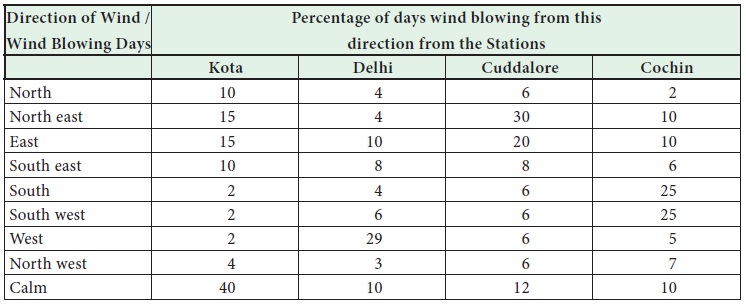
Exercise 5
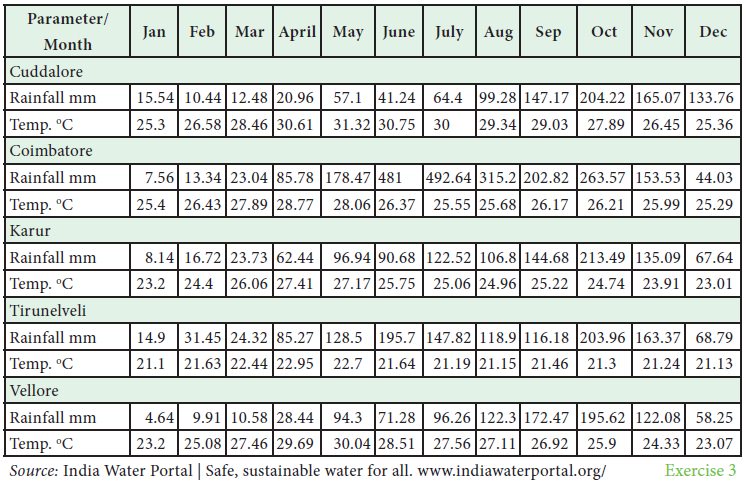
Draw wind rose diagram for the
following stations.
Related Topics