Examples | Geography - Climatic Diagrams | 11th Geography : Chapter 10 : Representation of Relief Features and Climatic Data
Chapter: 11th Geography : Chapter 10 : Representation of Relief Features and Climatic Data
Climatic Diagrams
Climatic
Diagrams
Climatic diagrams show specific
weather element for a specific station for a specific time. Graph, bar charts,
combination of graph and bar and wind roses are few climatic diagrams drawn to
represent climatic data. Mean monthly temperature of stations can be shown in
simple graph. Comparison of maximum, minimum temperature with mean monthly
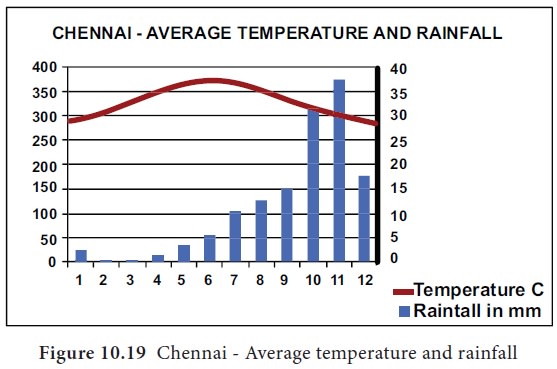
temperature can be done by drawing a multiple graph. Generally rainfall is
shown as bar diagram for
individual station. Special climatic diagrams combine both bar and graph to
show the climatic variations among stations.
Examples
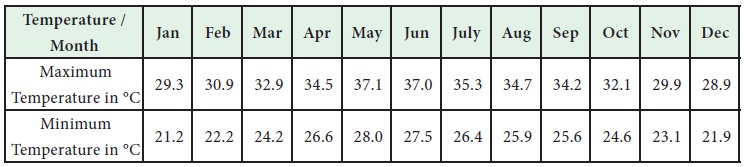
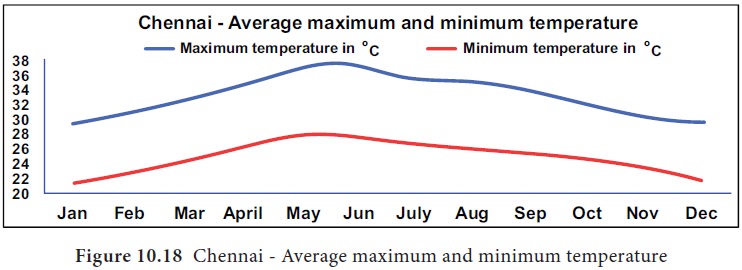
1. Draw graph to show the average
maximum and minimum temperature for Chennai city.
In the x axis,mark the months of the
year. 1 cm = one month
In the y axis, mark the temperature
after selecting suitable scale considering the lowest and highest temperature
of the station. (1 cm = 2 degrees Celsius)
Related Topics