Geography - Profile Diagram | 11th Geography : Chapter 10 : Representation of Relief Features and Climatic Data
Chapter: 11th Geography : Chapter 10 : Representation of Relief Features and Climatic Data
Profile Diagram
Profile
Diagram
Contour diagram and cross section are
drawn for selected features of the earth. In a continuous landscape one may be
interested to visualize the general sky line for an area along a selected path.
Profile or a section is a method which helps to visualize the relief feature
for a larger area drawn along a selected base line.
Types of Profiles
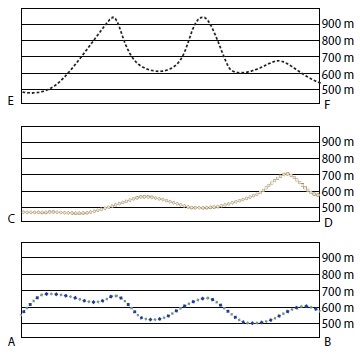
Profiles drawn for three or four
selected individual base line are called Serial profiles. When profile sections of all serial profiles are drawn on a same
vertical baseline it is named as superimposed profile. When one of the serial profile is kept as a base and the elevated
portions of successive profiles are drawn it is known as projected
profile. The line joining
the topmost elevated portions of all the serial profiles drawn on a same base
line gives the sky line or summit line for that region.
This is termed as composite
profile.
Steps to Draw Profiles
Trace the contours in the toposheet
for a size of 10 cm by 10 cm with the contour height.
Select four base lines at a distance
of 2.5 cm each. Name them as AB, CD and EF.
Draw the horizontal lines to
represent contour with suitable vertical exaggeration.
On this vertically exaggerated figure
carefully draw cross sections separately for all the selected lines (AB, CD and
EF) as described in the previous section. They are named as serial
profile. Draw each section
in different colour for better visualisation.
For super imposed profile draw the sections of each line on
one vertically exaggerated line with the same colours used as before.
Draw a common vertically exaggerated
base line. First draw the cross section of AB line. Next while drawing the
cross section of CD line draw only those parts which are the higher than AB
line. Next draw the cross section of line EF which
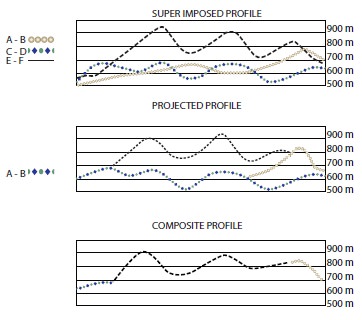
Draw these
cross sections with the respective colours drawn in serial profiles for better
understanding and visualization. This figure gives the projected
profile of the selected
region.
Composite
profile gives the topmost portion of each line joined as one
line on the same vertically exaggerated base line.
This gives the effect of the landscape
seen from a distance.
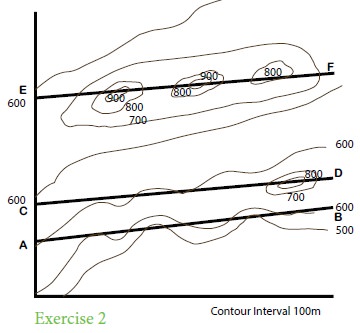
Exercise 2
Draw serial profile, superimposed
profile, projected and composite profile for the given contour diagram.
Related Topics