Chapter: Civil Surveying : Fundamentals and Chain Surveying
Surveying Office Work
OFFICE
WORK
OFFICE WORK in surveying consists of
converting the field measurements into a usable format. The conversion of
computed, often mathematical, values may be required immediately to continue
the work, or it may be delayed until a series of field measurements is
completed. Although these operations are performed in the field during lapses
between measurements, they can also be considered office work. Such operations
are normally done to save time. Special equipment, such as calculators,
conversion tables, and some drafting equipment, are used in most office work.
In office work, converting field
measurements (also called reducing) involves the process of computing,
adjusting, and applying a standard rule to numerical values.
Computation
In any field survey operation,
measurements are derived by the application of some form of mathematical
computation. It may be simple addition of several full lengths and a partial
tape length to record a total linear distance between two points. It maybe the
addition or subtraction of differences in elevation to determine the height of
instrument or the elevation during leveling. Then again, it maybe checking of
angles to ensure that the allowable error is not exceeded.
Office computing converts these
distances, elevations, and angles into a more usable form. The finished
measurements may end up as a computed volume of dirt to be moved for a highway
cut or fill, an area of land needed for a SEABEE construction project, or a new
position of a point from which other measurements can be made.
In general, office computing reduces the
field notes to either a tabular or graphic form for a permanent record or for
continuation of fieldwork.
Adjustment
Some survey processes are not complete
until measurements are within usable limits or until corrections have been
applied to these measurements to distribute accumulated errors. Small errors
that are not apparent in individual measurements can accumulate to a sizeable
amount. Adjusting is the process used to distribute these errors among the many
points or stations until the effect on each point has been reduced to the
degree that all measurements are within usable limits.
For example, assume that 100
measurements were made to the nearest unit for the accuracy required. This
requires estimating the nearest one-half unit during measurement. At the end of
the course, an error of + 4 units results. Adjusting this means each
measurement is reduced 0.04 unit. Since the measurements were read only to the
nearest unit, this adjustment would not be measurable at any point, and the
adjusted result would be correct.
SIGNIFICANT
FIGURES.- The term known to be exact.
In a measured quantity, the number of
significant figures is determined by the accuracy of the measurement. For
example, a roughly measured distance of 193 ft has three significant figures.
More carefully measured, the same distance, 192.7 ft, has four significant
figures. If measured still more accurately, 192.68 ft has five significant
figures.
In surveying, the significant figures
should reflect the allowable error or tolerance in the measurements. For
example, suppose a measurement of 941.26 units is made with a probable error of
� 0.03 unit. The � 0.03 casts some doubt on the fifth digit which can vary from
3 to 9, but the fourth digit will still remain 2. We can say that 941.26 has
five significant figures; and from the allowable error, we know the fifth digit
is doubtful. However, if the probable error were �0.07, the fourth digit could
be affected. The number could vary from 941.19 to 941.33, and the fourth digit
could be read 1, 2, or 3. The fifth digit in this measurement is meaningless.
The number has only four significant figures and should be written as such.
The number of significant figures in a
number ending in one or more zeros is unknown unless more information is given.
The zeros may have been added to show the location of the decimal point; for
example, 73200 may have three, four, or five significant figures, depending on
whether the true value is accurate to 100, 10, or 1 unit(s). If the number is
written 73200.0, it indicates accuracy is carried to the tenth of a unit and is
considered to have six significant figures.
When decimals are used, the number of
significant figures is not always the number of digits. A zero may or may not
be significant, depending on its position with respect to the decimal and the
digits. As mentioned above, zeros may have been added to show the position of
the decimal point. Study the following examples:
0.000047
. . . . . . .two significant figures
0.0100470
. . . . . . .six significant figures
0.1000470
. . . . . . .seven significant figures
2.0100470
. . . . . . .eight significant figures
In long computations, the values are
carried out to one more digit than required in the result. The number is
rounded off to the required numbers of digits as a final step.
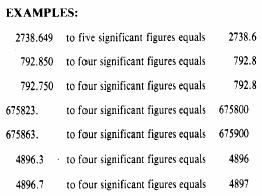
ROUNDING OFF NUMBERS.- Rounding
off is the process of dropping one or more digits and replacing them
with zeros, if necessary, to indicate the number of significant figures.
Numbers used in surveying are rounded off according to the following rules:
1.
When the digit to be dropped is less
than 5, the number is written without the digit or any others that follow it.
(Example: 0.054 becomes 0.05.)
2.
When the digit is equal to 5, the
nearest EVEN number is substituted for the preceding digit. (Examples: 0.055
becomes 0.06; 0.045 becomes 0.04.)
3.
When the digit to be dropped is greater
than 5, the preceding digit is increased by one. (Example: 0.047 becomes 0.05.)
4.
Dropped digits to the left of the
decimal point are replaced by zeros.
CHECKING COMPUTATIONS.- Most
mathematical problems can be solved by more than one method. To check a
set of computations, you should use a method that differs from the original
method, if possible. An inverse solution, starting with the computed value and
solving for the field data, is one possibility. The planimeter and the
protractor are also used for approximate checking. A graphical solution can be
used, when feasible, especially if it takes less time than a mathematical or
logarithmic solution. Each step that cannot be checked by any other method must
be recomputed; and, if possible, another EA should recompute the problem. When
an error or mistake is found, the computation should be rechecked before the
correction is accepted
Drafting
Used In Surveying
The general concept of drafting and the
use of drafting instruments were discussed in chapters 2 through 5. By this
time, you should be familiar with the use of various drafting instruments and
with the elements of mechanical drawing. Draft-ing used in surveying, except
for some freehand sketches, is generally performed by mechanical means; for
example, the drawing of lines and surveying symbols is generally done with the
aid of a straightedge, spline, template, and so on.
The drawings you make that are directly
related to surveying will consist of maps, profiles, cross sections, mass
diagrams, and, to some extent, other graphical calculations. Their usefulness
depends upon how accurately you plot the points and lines representing the
field measurements. It is important that you adhere to the requirements of
standard drawing practices. Correctness, neatness, legibility, and well
proportioned drawing arrangements are signs of professionalism.
In drawing a PROPERTY map, for example,
the following general information must be included:
1.
The length of each line, either
indicated on the line itself or in a tabulated form, with the distances keyed
to the line designation.
2.
The bearing of each line or the angles
between lines.
3.
The location of the mapped area as
referenced to an established coordinate system.
4.
The location and kind of each
established monument indicating distances from referencemarks.
5.
The name of each road, stream, landmark,
and so on.
6.
The names of all property owners,
including those whose lots are adjacent to the mapped area.
7.
The direction of the true or magnetic
meridian, or both.
8.
A graphical scale showing the
corresponding numerical equivalent.
9.
A legend to the symbols shown on the
map, if those shown are not standard signs.
10.
A title block that distinctly identifies
the tract mapped or the owner'snam.(It is required to contain the name of the
surveyor, the name of the draftsman, and the date of the survey.)
Besides the above information, there are
some other items that may be required if the map is to become a public record.
When this is the case, consult the local office of the Bureau of Land
Management or the local surveyors'societyfor the correct general information
requirements to be included in the map to be drawn.
In drawing maps that will be used as a
basis for studies, such as those to be used in roads, structures, or waterfront
construction, you are required to include the following general information:
1.
Information that will graphically
represent the features in the plan, such as streams, lakes, boundaries, roads,
fences, and condition and culture of the land.
2.
The relief or contour of the land.
3.
The graphical scale.
4.
The direction of the meridian.
5.
The legend to symbols used, if they are
not conventional signs.
6.
A standard title block with a neat and
appropriate title that states the kind or purpose of the map. Again, the
surveyor'snameandthat of the draftsman, as well as the date of survey, are to
be included in the title block.
Maps developed as a basis for studies
are so varied in purpose that the above information may be adequate for some
but inadequate for others. The Engineering Aid, when in doubt, should consult
the senior EA, the engineering officer, or the operations officer as to the
information desired in the proposed map. The senior EA or the chief of the
field survey party is required to know all these requirements before actual
fieldwork is started.
A map with too much information is as
bad as a map with too little information on it. It is not surprising to find a map
that is so crowded with information and other details that it is hard to
comprehend. If this happens, draw the map to a larger scale or reduce the
information or details on it. Then, provide separate notes or descriptions for
other information that will not fit well and thus will cause the appearance of
overcrowding. Studying the features and quality of existing maps developed by
NAVFACENGCOM and civilian architects and engineers (A & E) agencies will
aid you a great deal in your own map drawing.
Related Topics