Statistics | Term 3 Chapter 5 | 7th Maths - Summary | 7th Maths : Term 3 Unit 5 : Statistics
Chapter: 7th Maths : Term 3 Unit 5 : Statistics
Summary
Summary
● Based on the purpose, appropriate data
has to be collected and organised to find the representative of data.
● Representative of data are also known
as measures of central tendency.
● Arithmetic mean is the most commonly
used representative of data and is calculated by the formula.
Arithmetic Mean = Sum of all observations
/ Number of observations
● Mode is the value of the data which occurs maximum
number of times.
● A data may have more than one mode
as well as no mode.
● A data is of large size, mode can be
found out after grouping.
● Median is the middle most value of
the given data.
● To find the median for the given data,
(i) arrange
the data in ascending or descending order.
(ii) If the number of terms (n) is odd,
then{ [n + 1]/2} th term is the median.
(iii) If the number of terms (n) is even,
then average of (n/2)th and ([n/2]+ 1)th terms is the median
ICT Corner
Statistics
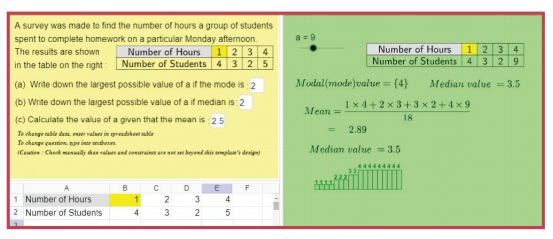
Expected outcome

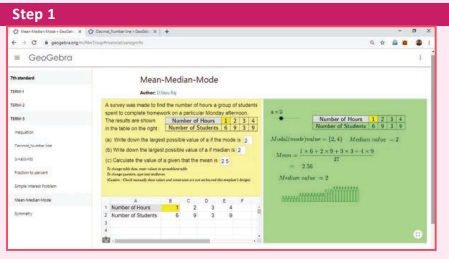
Step – 1
Open the Browser and type the URL Link
given below (or) Scan the QR Code. GeoGebra work sheet named “Mean-Median-Mode”
will open. Change the number of students by typing your number. Right side you can
see the Mean, Median and Mode.

Browse in the link
Mean-Median-Mode: https://www.geogebra.org/m/ f4w7csup#material/sanzgm9n or Scan
the QR Code.
Related Topics