Statistics | Term 3 Chapter 5 | 7th Maths - Mode | 7th Maths : Term 3 Unit 5 : Statistics
Chapter: 7th Maths : Term 3 Unit 5 : Statistics
Mode
Mode
As we have discussed earlier that the
arithmetic mean is one of the form of representative value or measures of central
tendency of a group of data. Depending upon the data and its purpose, other measures
of central tendency may be used.
Consider the example of sale details
of different sizes of footwear in a shop for a week.
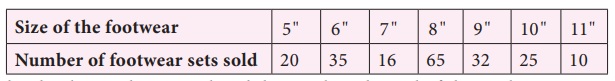
The shopkeeper has to replenish his stock
at the end of the week. Suppose we find the arithmetic mean of the footwear sold,
Mean= [ 20+35+16+65+32+25+10] / 7 = 203/7
= 29
Average number of footwear is 29. This
means that the shopkeeper has to get 29 pairs of footwear in each size. Will it
be wise to decide like this?
It has to be observed that the maximum
purchase falls on the footwear of size 8 inches. So the shopkeeper has to get more
number of footwear of size 8 inches. Hence arithmetic mean does not suit for this
purpose. Here we need another type of representative value of data called ‘Mode’.
Mode is the value of the data which occurs
maximum number of times.
Consider another example.
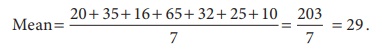
A shopkeeper analyses his sales data
of readymade shirts to plan for the stock according to the demand. The sale details
of shirts are given below.
Here he observes that there is a equal
demand for shirts of sizes 30" and 34 " . Now this data has two modes
as there are two maximum occurrences namely 30" and 34 " . He stocks more
shirts of these 2 sizes. Note that, this data has two mode and it is known as bimodal
data.
Try these
(1) Find the mode of the following data. 2,6,5,3,0,3,4,3,2,4,5,2
Solution:
Arranging the numbers in ascending order we get 0, 2, 2, 2, 3,
3, 3,4, 4, 5, 5, 6
Since 2 and 3 occurs the maximum of 3 times. So mode of this
data is 2 and 3.
(2) Find the mode of the following data set. 3, 12, 15, 3, 4, 12,
11, 3, 12, 9, 19
Solution:
Arranging the given data in ascending order : 3, 3, 3, 4, 9, 11,
12, 12, 12, 15, 19.
The data 3 and 12 occurs the maximum of 3 times.
So mode of this data is 3 and 12.
(3) Find the mode of even numbers within 20.
Solution:
Even numbers within 20 arc 2, 4, 6, 8, 10, 12. 14. 16, 18.
There is no mode for this data.
Example 5.5
Find the mode of the given
set of numbers. 5, 7, 10, 12, 4, 5, 3, 10, 3, 4, 5, 7, 9, 10, 5, 12, 16, 20,
5
Solution:
Arranging the numbers in ascending order
without leaving any value, we get, 3, 3, 4, 4, 5, 5, 5, 5, 5, 7, 7, 9, 10, 10, 10,
12, 12, 16, 20
Mode of this data is 5, because it occurs
more number of times than the other values.
Note
To find mode, arranging
the raw data in ascending order is not mandatory. It helps us to ensure that each
and every value is taken into account for the calculation of mode and helps in identifying
the mode value easily.
Example 5.6
The marks obtained by 11
students of a class in a test are 23, 2, 15, 38, 21, 19, 23, 23, 26, 34, 23. Find
the mode of the marks.
Solution:
Arranging the given marks in ascending
order, we get,
2, 15, 19, 21, 23, 23, 23, 23, 26, 34,
38.
Clearly, 23 occurs maximum number of
times. Hence mode of marks=23.
Example 5.7
Find the
mode of the following data 123, 132, 145, 176, 180, 120
Solution:
From the above data, we can see that
there is no repetition of values in the given data. Each observation occurs only
once, so there is no mode.
Note
When each of the observations
have occurred only once, then there is no mode for the data.
Think
1. A toy factory making variety of toys for kids, wants to know the
most popular toy liked by all the kids. Which average will be the most appropriate
for it?
Solution:
Mode.
2. Is there a mode exists
between the odd numbers from 20 to 40? Discuss.
Solution: Odd number between 20 to 40 are 21, 23, 25, 27, 29, 31, 33, 35,
37, 39.
As all numbers occurs only once there is no mode for
this data.
1. Mode of large data
When size of the data is large, it is
not easy to identify the value which occurs maximum number of times. In that case,
we can group the data by using tally marks and then find the mode.
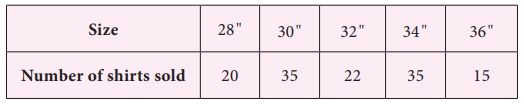
Consider the example to find the mode
of the number of goals scored by a football team in 25 matches. The goal scored
are 1, 3, 2, 5, 4, 6, 2, 2, 2, 4, 6, 4, 3, 2, 1, 1, 4, 5, 3, 2, 2, 4, 3, 0, 1.
To find the mode of this data, the number
of goals score starting from 0 and ending with a maximum of 6 is represented in
the form of a table.
From the table we observe that the highest
frequency is 7, which corresponds to number of goals, that is 2. Hence, the mode
is 2.
Example 5.8
Find the mode of the following
data. 14, 15, 12, 14, 16, 15, 17, 13, 16, 16, 15, 12, 16, 15, 13, 14, 15, 13, 15, 17, 15, 14, 18, 19, 12, 14, 15,
16, 15, 16, 13, 12.
Solution:
We tabulate the data as follows.
The whole data ranges from 12 to 19.
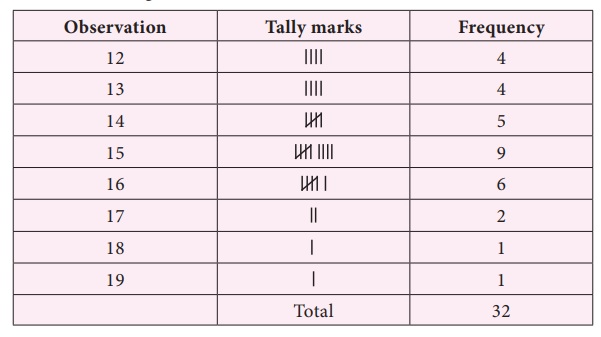
The highest frequency is 9 which corresponds
to the value 15. Hence the mode of this data is 15.
Example 5.9
The following data shows
that the number of hours spent by the students for study.
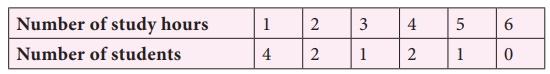
Find the mode.
Solution:
Since the one hour study time is spent
by maximum number of students, the mode of the data is 1 hour.
Think
Which average will be most
aprropriate for the companies producing the following goods? why?
(i) Diaries and notebooks
(ii) School bags (iii) Jeans and T-shirts
Solution:
For all the above data mode will be more appropriate.
Related Topics