Term 1 Chapter 5 | 6th Maths - Statistics | 6th Maths : Term 1 Unit 5 : Statistics
Chapter: 6th Maths : Term 1 Unit 5 : Statistics
Statistics
Chapter 5
STATISTICS

Learning Objectives
* To understand the
necessity to collect the data.
* To organise collected
data using tally marks.
* To understand the
need for scaling in pictographs.
* To draw pictographs
and interpret them.
* To draw bar graphs and interpret them.
Recap
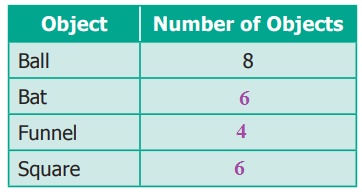
Count the objects in the following figure and complete
the table that follows:
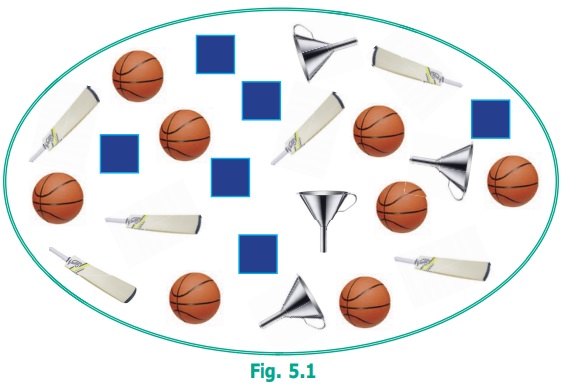
From the given Fig 5.1 and the table, answer the
following questions.
(i) The total number of objects in the above picture
is 24.
(ii) The difference between the number of squares
and the number of bats is 6 − 4 = 2.
(iii) The ratio of the number of balls to the number
of bats is 8 : 6.
(iv) What are the objects equal in number?
Answer: Bat and Square
(v) How many more balls are there than the number
of bats?
Answer: 2 balls more than
bats
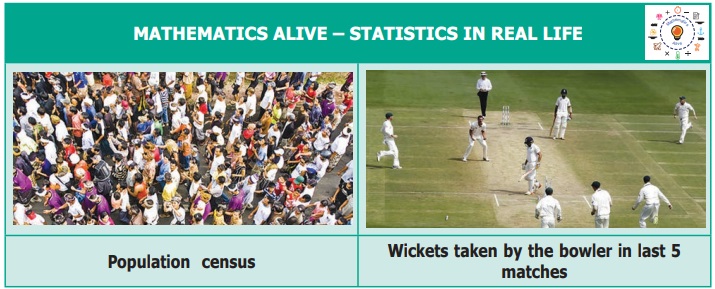
Introduction
MATHEMATICS ALIVE – STATISTICS IN
REAL LIFE
Related Topics