Statistics | Term 1 Chapter 5 | 6th Maths - Representation of data using Bar Graph | 6th Maths : Term 1 Unit 5 : Statistics
Chapter: 6th Maths : Term 1 Unit 5 : Statistics
Representation of data using Bar Graph
Representation
of data using Bar Graph
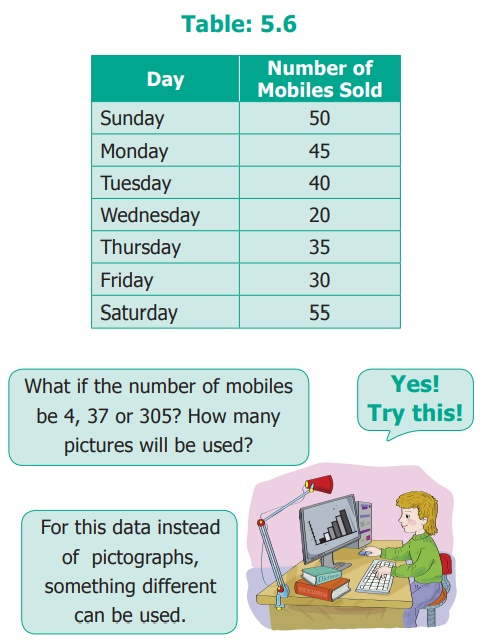
Ragavi’s father is a mobile shop owner. She finds
the following data of sale of mobiles in a week.
Note
A Bar graph
consists of equally − spaced parallel bars (Horizontal or Vertical) whose lengths
/ heights are proportional to the number of items given.
1.
Drawing Bar-Graph
Step1. Draw two lines which are perpendicular
to each other. One of them is horizontal and the
other one is vertical.
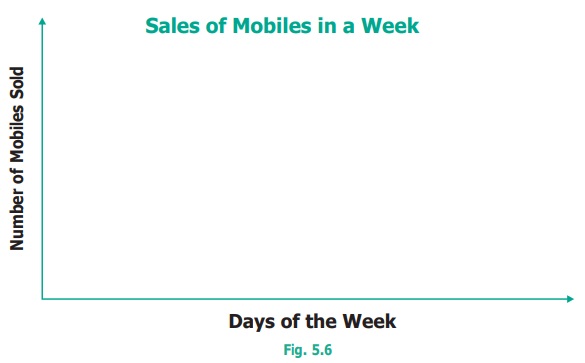
Step2. A suitable title (Sale of mobiles in
a week) is given. The lines are labelled (Horizontal line → Days of the week; vertical line → Number of mobiles sold).
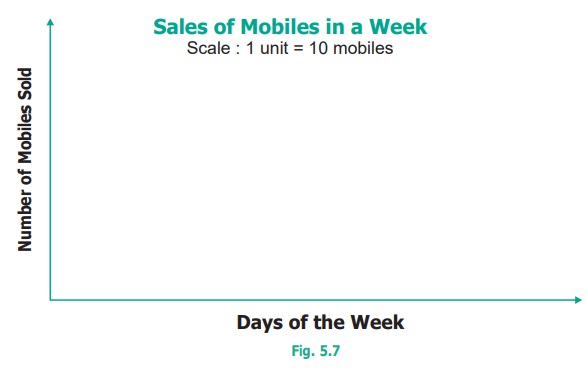
Step3. A suitable scale is chosen. The scale
used is stated on the graph.
Step4. Let the vertical line start from 0 and
the values of information are marked at equal distances
in same increments.
Step5.For each information vertical bars are
drawn on the horizontal line. They are labelled
by respective information (as Monday, Tuesday… Sunday).
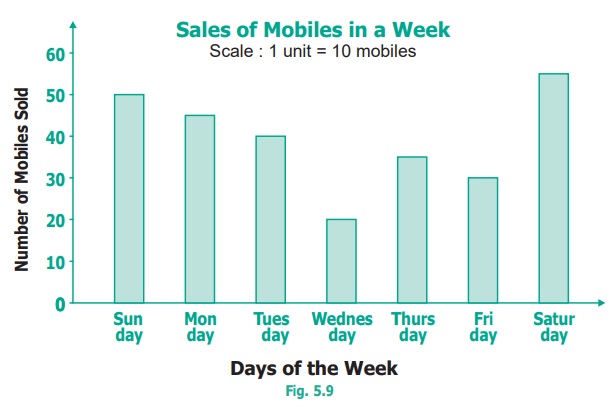
This graph is called as Vertical Bar Graph.
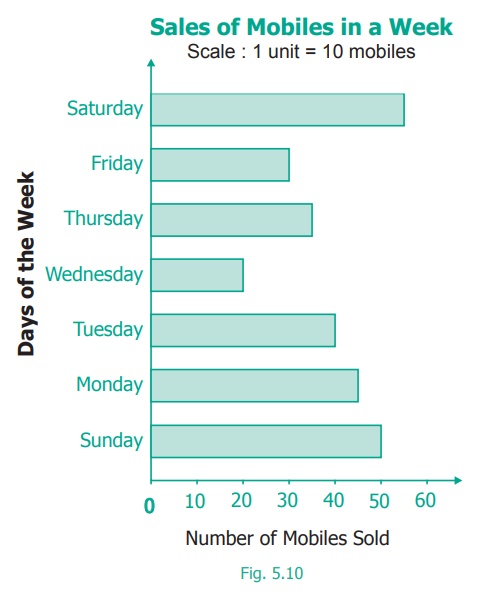
The corresponding horizontal Bar Graph will look like this:
Sales of Mobiles in a Week
Scale: 1 unit = 10 mobiles
Think
Why are these important?
● The width of each bar is same.
● The spaces between any two bars
are also the same.
2.
Interpreting the Bar Graph
The data from the above Bar Graph (Fig. 5.10) can
be easily interpreted and analyzed as follows.
● The maximum number of mobiles were sold on Sunday (55).
● The minimum number of mobiles were sold on Thursday
(20).
● The total number of mobiles sold in the week (50+45+40+20+35+30+55
= 275).
● The number of mobiles sold on a particular day (for example: on Friday is 35, etc.,).
Activity
Collect different data from Newspapers,
Magazines, etc. and interpret them using Bar graphs.
Example 5.4
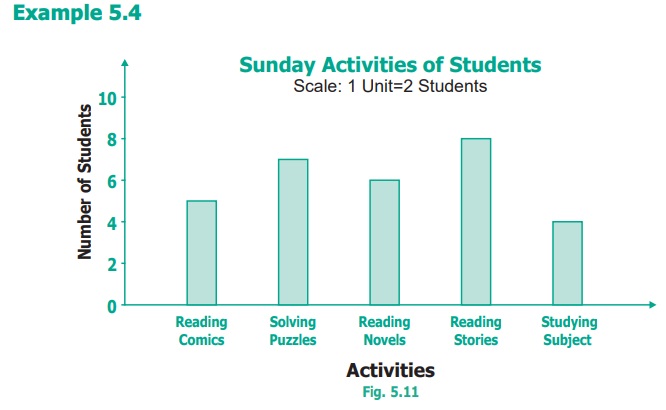
Study the above Bar graph and answer the following
questions.
(i) Which activity is followed by maximum number
of students?
(ii) How many students in all, spend their time
on solving puzzles?
(iii) The total number of students who follow either
reading stories or reading their subjects is __________.
(iv) The activity followed by minimum number of
students is __________.
(v) The number of students who took part in reading
comics is __________.
Solution
(i) ‘Reading stories’ is followed by maximum number
of students.
(ii) 7 students spend their time to work out solving
puzzles.
(iii) 8 + 4 = 12 students spend their time on reading.
(iv) ‘Studying subject’ is followed by minimum number
of students.
(v) 5 students spend their time on reading comics.
Think
Can you use
1 unit =1 student? Justify your answer.
Related Topics