Statistics | Term 1 Chapter 5 | 6th Maths - Organizing Data | 6th Maths : Term 1 Unit 5 : Statistics
Chapter: 6th Maths : Term 1 Unit 5 : Statistics
Organizing Data
Organizing
Data
The collected data are to be arranged methodically
or logically so that the information can be looked up fast whenever needed, easily
and efficiently. The method of organizing the data is discussed as follows.
1.
Tally Marks
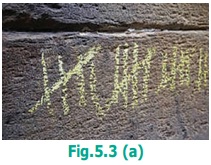
Consider the data collected by Santhi (given in
Table:5.1). Is it easy to get the required information from the data? For example,
can any one quickly tell the number of people who do not like Laddu? No. So she
decides to organize the data (See Fig. 5.3 (a)).
Her friends come to help her. Malar arranges the
data a given below in the table. She uses ‘✓’ marks to note down how many friends like
each of the sweets. The count of each sweet is called as “Frequency”.
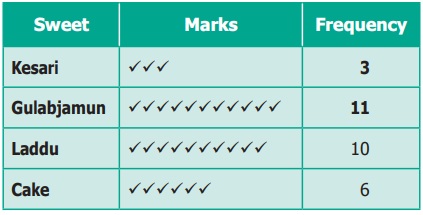
But, Rahim arranges the data as shown below.
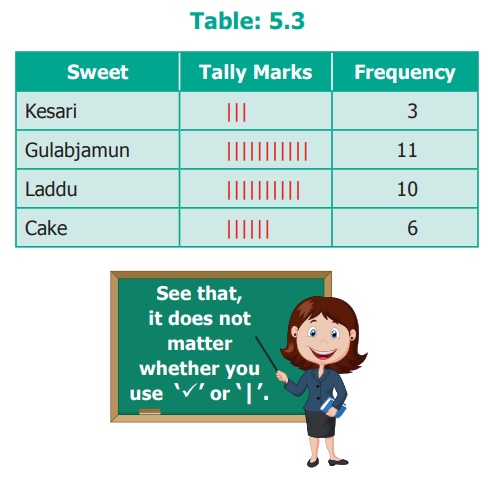
See that, it does not matter whether you use ‘✔’ or ‘|’.
Both have done well. But one would prefer tally
marks as they are very simple.
So, the teacher arranges the data as follows:
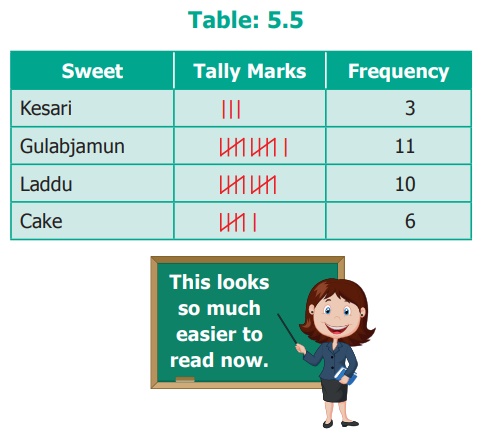
This looks so much easier to read now.
The standard form of representing the data is got by using ‘Tally marks’.
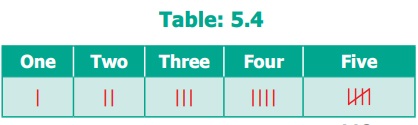
Note
* The
occurrence of each information is marked by a vertical line ‘|’.
* Every
fifth tally is recorded by striking through the previous four vertical lines as
‘ ![]() ’.
’.
* This makes counting up the tallies
easy.
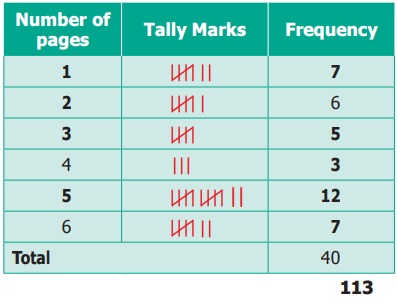
Example 5.1
Thamarai is fond of reading books. The number of
pages read by her on each day during the last 40 days are given below. Make a Tally
Marks table.
1 3 5 6 6 3 5 4 1 6 2 5 3 4 1 6 6
5 5 1
1 2 3 2 5 2 4 1 6 2 5 5 6 5 5 3 5
2 5 1
Solution
The Tally marks table is given below.
Think
If someone asks, “typically, how many
pages does Thamarai read in one day?”, what will be your answer?
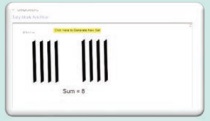
ICT Corner
STATISTICS
Expected
Result is shown in this picture
Step – 1
Open
the Browser and copy and paste the Link given below (or) by typing the URL given
(or) Scan the QR Code.
Step − 2
GeoGebra
worksheet “Tally Mark Addition” will appear. You can generate a new set by clicking
“Click here to generate a new set”.
Step-3
Select
“Show Answer” check box to view the answers for the sets.
Step 4:
Generate
various results and observe the difference in set formation
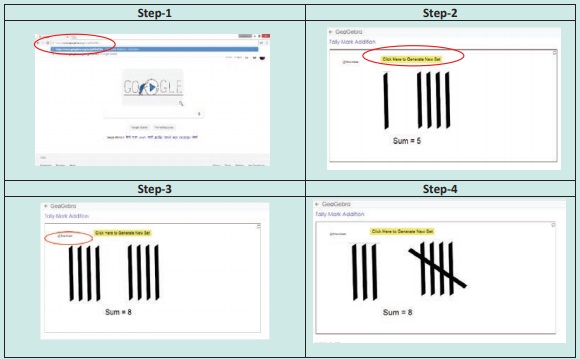
Geogebra’s
url :
https://www.geogebra.org/m/gzRAnHKw
Alternate source to try tally calculations:
https://play.google.com/store/apps/details?id=org.geogebra&hl=en
Related Topics