Statistics | Term 1 Chapter 5 | 6th Maths - Representation of data using Pictograph | 6th Maths : Term 1 Unit 5 : Statistics
Chapter: 6th Maths : Term 1 Unit 5 : Statistics
Representation of data using Pictograph
Representation
of data using Pictograph
The teacher was discussing about the pollution caused
by the vehicles. The students said that they saw many vehicles when they were standing
in the bus stop while coming to school. Everyone described in their own way, but
Azhagi drew the pictures of the vehicles that she had seen, as shown below.
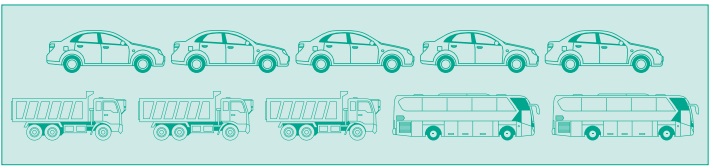
All the students were able to easily understand
that Azhagi had seen 5 cars, 3 lorries and 2 buses. This sort of representation
of data using pictures is called Pictograph.
Nowadays pictographs are frequently used in promotion
of tourism, weather forecast, geography etc.
Advantages of using Pictograph
● The data can
be easily analyzed and interpreted.
● The pictures
and symbols help us to understand better.
Note
A pictograph is the representation
of data through pictures.
Do you Know?
● The pictograph is a pictorial representation
for a word or Phrase.
● A pictograph is also called Pictogram.
● Pictographs were used as the earliest
known form of writing examples having been discovered in Egypt and Mesopotomia since
3000 BC.
1.
Need for scaling in the Pictograph
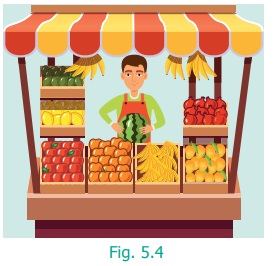
Fig. 5.4 shows, a fruit stall where there are 40
mangoes, 55 apples, 35 oranges and 60 bananas. How can we represent this data by
using pictures? If the data is very large, it is very difficult and time consuming
to represent each of the fruits in a pictograph. In such cases, we can use one picture
to represent many of the same kind. This is called scaling.
2.
Drawing Pictographs
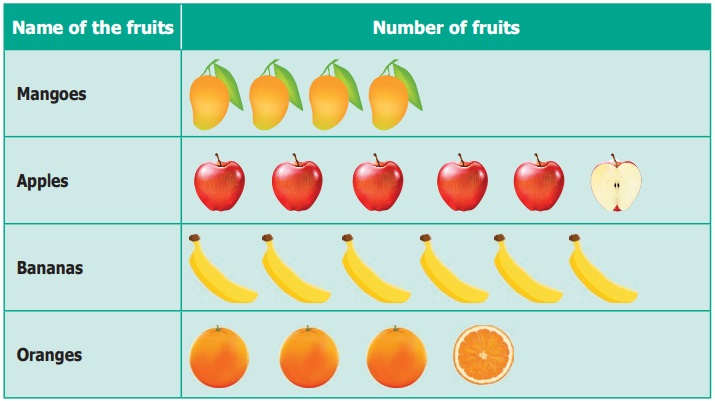
Consider the above data of fruits. 40 and 60 are
multiples of 10, while 55 and 35 are multiples of 5. Let us assume, that One full picture
of fruit represents 10 fruits and One half picture represents 5 fruits.
The pictograph can be drawn for the above data as
shown below.
3.
Interpreting pictograph
From the above pictograph the number of fruits can
be calculated very easily.
Number of
Mangoes = 4 full pictures ⇒ 4
× 10 = 40 mangoes
Number of Apples = 5 full pictures and 1 half picture
⇒ (5 × 10) + 5 = 55 apples
Number of Bananas = 6 full pictures ⇒ 6 × 10 = 60 bananas
Number of Oranges = 3 full pictures and 1 half picture
⇒ (3 × 10) + 5 = 35 oranges
Example 5.2
The following table shows the number of vehicles
sold in a year.
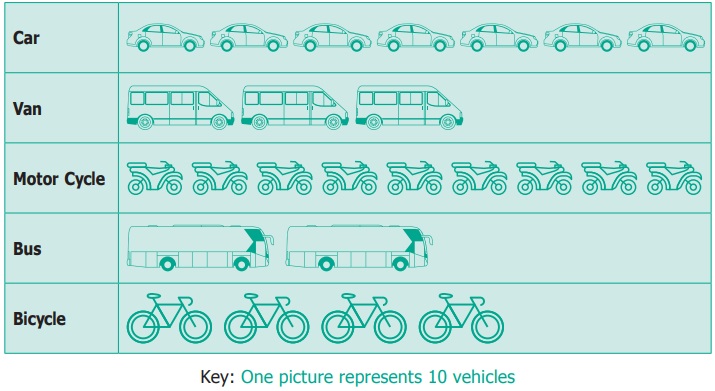
Look at the pictograph and answer the following
questions.
(i) How many motor cycles were sold in a year?
(ii) Number of buses sold in a year is 20. Say True
or False.
(iii) How many bicycles were sold ?
(iv) How many cars and vans were sold?
(v) How many vehicles were sold altogether?
Solution
Given : 1 picture represents 10 vehicles
(i) There were 9 × 10 = 90 motor cycles sold.
(ii) True.
(iii) There were 4 × 10 = 40 bicycles sold.
(iv) There were 7 cars and 3 vans pictures.
Therefore 70 + 30 = 100 cars and vans sold.
(v) There were 7 cars, 3 vans, 9 motor cycles, 2
buses and 4 bicycles sold. Therefore, 70 + 30 + 90 + 20 + 40 = 250 vehicles sold.
Example 5.3
The pictograph shows the number of branded mobile
phones sold in five months.
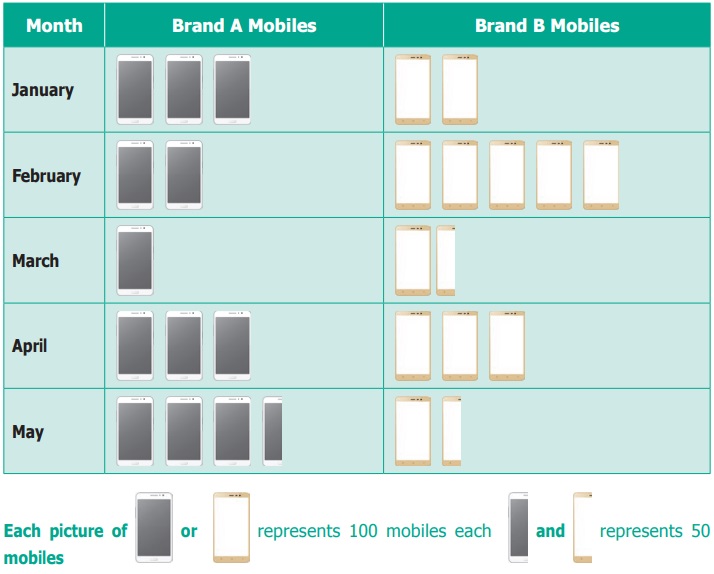
Observe the given table and answer the following
questions.
(i) In which month was the maximum number of brand
B mobiles sold?
(ii) In which month was equal number of brand A
and brand B mobiles sold?
(iii) In which month was the minimum number of brand
A mobiles sold?
(iv) Find the total number of Brand A Mobiles that
were sold in 5 months.
(v) What is the difference between the sale of brand
A and brand B Mobiles in the month of May?
Solution
(i) February
(ii) April
(iii) March
(iv) 1250
(v) Brand A has sold 200 mobiles more than brand
B
Activity
Collect from class VI students data
regarding games they like and then draw a pictograph for the data collected.
Related Topics