Questions with Answers, Solution | Statistics | Term 1 Chapter 5 | 6th Maths - Exercise 5.3 | 6th Maths : Term 1 Unit 5 : Statistics
Chapter: 6th Maths : Term 1 Unit 5 : Statistics
Exercise 5.3
Exercise
5.3
1.
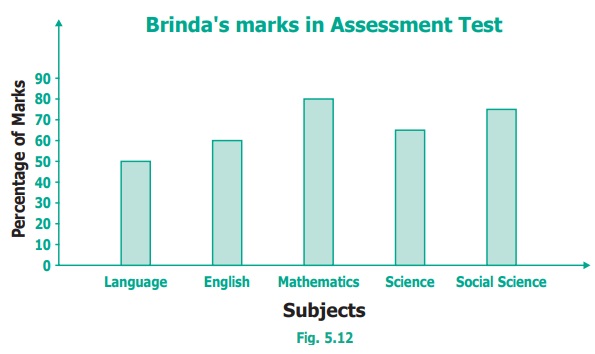
Read the given Bar Graph which shows the percentage of marks obtained by Brinda
in different subjects in an assessment test.
Observe
the Bar Graph and answer the following questions.
(i)
1 Unit = 10 % of marks on vertical line.
(ii)
Brinda has scored maximum marks in Mathematics subject.
(iii)
Brinda has scored minimum marks in Language subject.
(iv)The
percentage of marks scored by Brinda in Science is 65%.
(v)
Brinda scored 60% marks in the subject English.
(vi)Brinda
scored 20% more in Mathematics subject than English subject.
2.
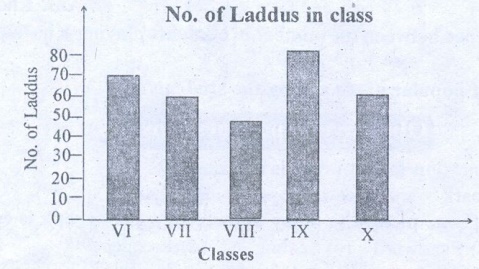
Chitra has to buy Laddus in order to distribute to her friends as follows:
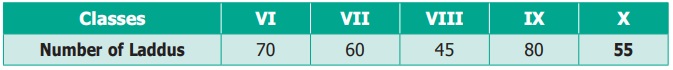
Draw
a Bar Graph for this data.
Solution:
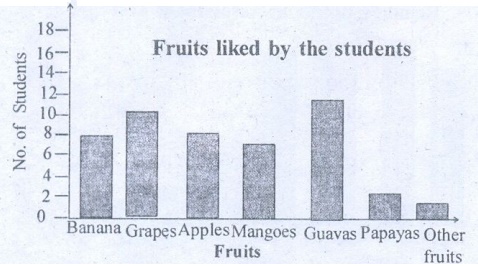
3. The fruits liked
by the students of a class are as follows:
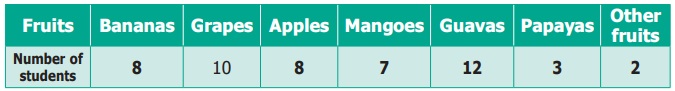
Draw
a Bar Graph for this data.
Solution:
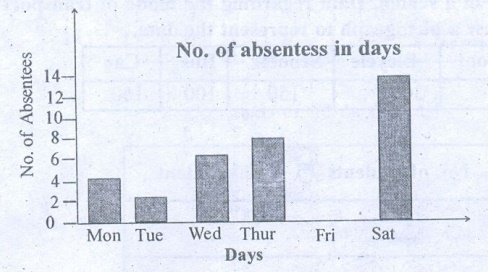
4.
The pictograph below gives the number of absentees on different days of the week
in class six. Draw the Bar graph for the same.
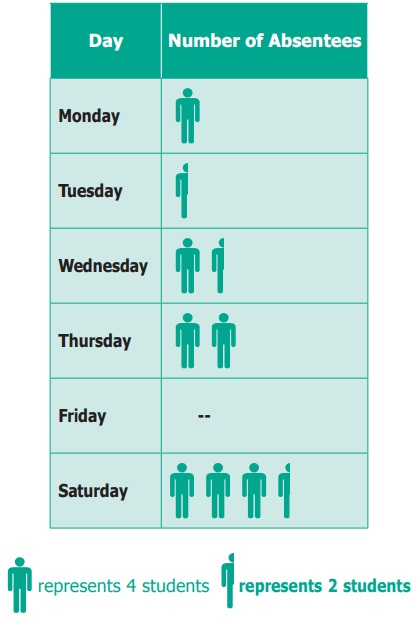
Solution:
Objective
Type Questions
5.
A bar graph cannot be drawn using __________.
(a)
Horizontal bars only
(b)
Vertical bars only
(c)
Both horizontal bars and vertical bars
(d)
Either horizontal bars or vertical bars.
Answer: (d) Either horizontal bars or vertical bars
6.
The spaces between any two bars in a bar graph __________.
(a)
can be different
(b)
are the same
(c)
are not the same
(d)
all of these
Answer: (b) are the same
Answers:
Exercise 5.3
1) i) 10
ii) Mathematics
iii) Language
iv) 65%
v) English
vi) Mathematics; Science
5) (d) Either horizontal bars or vertical bars.
6) (b) are the same
Related Topics