Chapter: Civil : Soil Mechanics : Soil Classification And Compaction
Standard Proctor Compaction Test
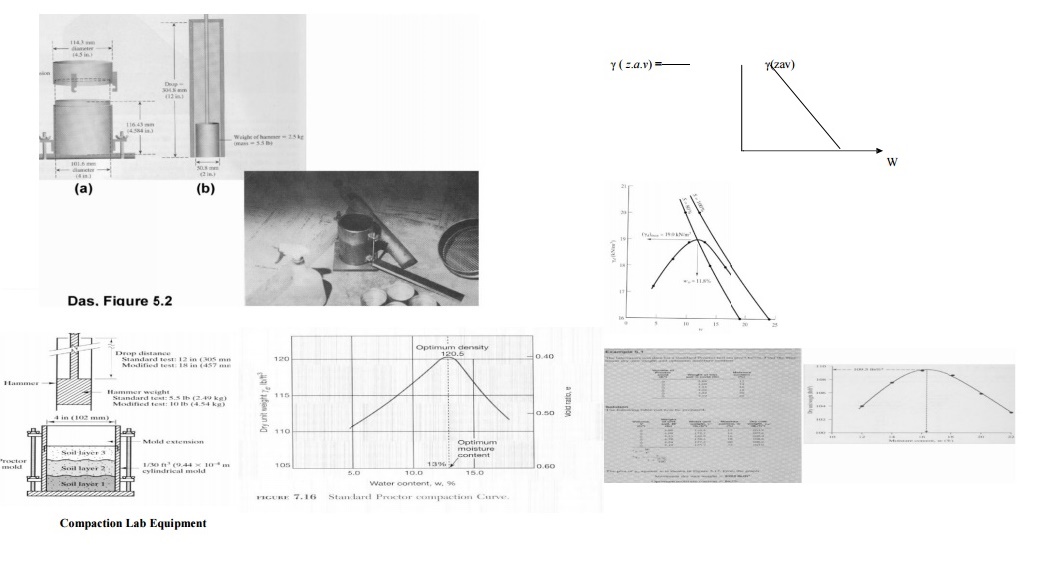
Standard Proctor Compaction Test
The
standard was originall y developed to simulate field compaction in the lab
Purpose:
Find the optimum moisture content
at which the maximum dry unit weig ht is attained ASTM D 698
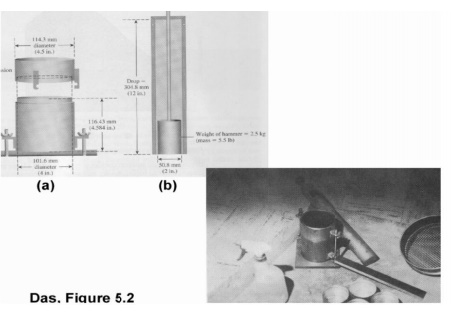
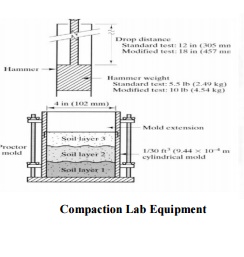
Equipments;
Standard Proctor; 1/30 ft3
mold 5.5 lb hammer; 12' drop
3 layers of soil; 25 blows / l ayer
Compaction Effort is calc ulated with the
following parameters
Mold volume = 1/30 cubic foot Compact in 3 layers
25blows/layer
5.5 lb hammer 12"
drop
Procedure
1. Obtain 10
lbs of soil pass ing No. 4 sieve
2. Record
the weight of the Proctor mold without the base and the (c ollar) extension,
the volume of which is 1/30 ft3.
3. Assemble
the compactio n apparatus.
4. Place the
soil in the mold in 3 layers and compact using 25 well dist ributed blows of
the Proctor hammer.
5. Detach
the collar without disturbing the soil inside the mold
6. Remove
the base and determine the weight of the mold and compacte d soil.
7. Remove
the compacted soil from the mold and take a sample (20-30 grams) of soil and
find the moisture content
Place the
remainder of th e molded soil into the pan, break it down, and thoroughly remix
it with the other soil, plus 100 additional grams of water.
Zero-air-void unit weight:
At
certain water content, w hat is the unit weight to let no air in the voids
It is clear that in the above
equation, specific gravity of the solid and thewater density are constant, the
zero-air-void density is inversely proportional to water content w. For a given
soil and water content the best possible compaction is represented by the
zero-air-voids curve. The actual compaction curve will always be below. For dry
soils the unit weight increases as water is added to the soil because the water
lubricates t he particles making compaction easier. As moree water is added and
the water content is larg er than the optimum value, the void spaces be come
filled with water so further compac tion is not possible because water is a
kind like incompressible fluid. This is illustrated by t he shape of the
zero-air-voids curve which decre ases as water content increases.
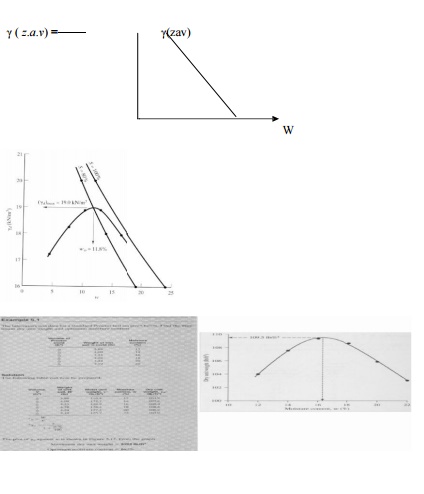
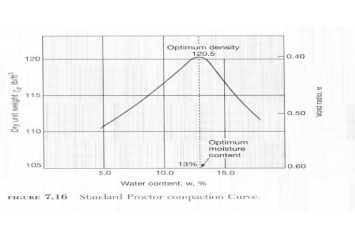
Compaction Curve
Compaction curve
plotted ?d vs. w.The peak of the
curve is the Maxim um Compaction (?d max) at Optimum Moisture Content
(wopt )
Results
Plot of dry unit weight vs m oisture content
Find
?d (max) and w and Plot
Zero-Air-Void unit weight (only S=100% )
Related Topics