Chapter: 12th Statistics : Chapter 5 : Regression Analysis
Properties of Regression Coefficients
PROPERTIES OF REGRESSION COEFFICIENTS
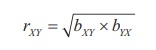
1. Correlation coefficient is the geometric mean between the
regression coefficients.
2. It is clear from the property 1, both
regression coefficients must have the same sign. i.e., either they will
positive or negative.
3. If one of the regression coefficients is
greater than unity, the other must be less than unity.
4. The correlation coefficient will have the
same sign as that of the regression coefficients.
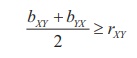
5. Arithmetic mean of the regression coefficients is greater than
the correlation coefficient.
6. Regression coefficients are independent of the change of origin
but not of scale.
Properties of regression equation
1. If r = 0, the variables are
uncorrelated, the lines of regression become perpendicular to each other.
2. If r = 1, the two lines of regression either coincide or
parallel to each other.
3. Angle between the two regression lines is θ = tan-1 (m1- m2 / 1+m1m2) where m1 and m2 are the slopes of regression lines X
on Y and Y on X respectively.
4. The angle between the regression lines
indicates the degree of dependence between the variable.
5. Regression equations intersect at (![]() ,
,![]() )
)
Example 5.3
Calculate the two regression equations of X on Y and
Y on X from the data given below, taking deviations from actual
means of X and Y.

Estimate the likely demand when the X = 25.
Solution:
The regression line of U on V is computed as under
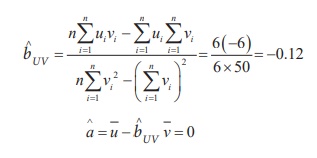
Hence, the regression line of U on V is U = ˆbUV
v + ˆa = −0.12v
Thus, the regression line of X on Y is (Y–43)
= –0.25(x–15)
When x = 25, y – 43 = –0.25 (25–15)
y = 40.5
Important Note: If ![]() ,
,![]() are not integers then
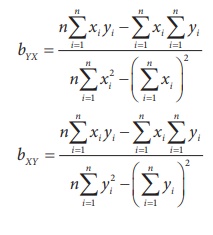
the above method is tedious and time consuming to calculate bYX and
bXY. The following modified formulae are easy for
calculation.
are not integers then
the above method is tedious and time consuming to calculate bYX and
bXY. The following modified formulae are easy for
calculation.
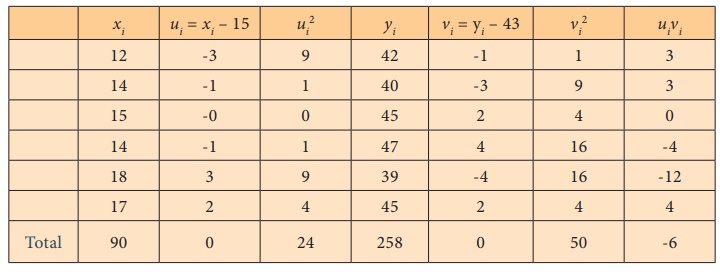
Example 5.4
The following data gives the experience of machine operators and
their performance ratings as given by the number of good parts turned out per
50 pieces.
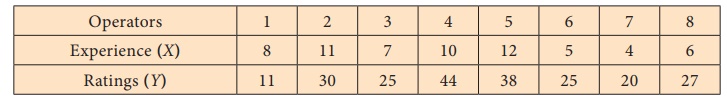
Obtain the regression equations and estimate the ratings
corresponding to the experience x=15.
Solution:
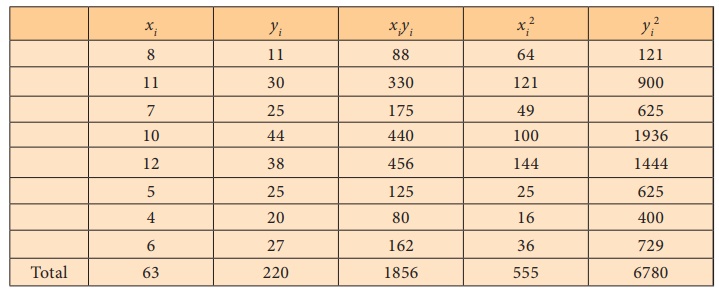
Regression equation of Y on X,
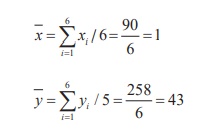
The above two means are in decimal places so for the simplicity we
use this formula to compute bYX .
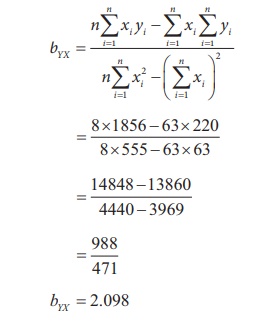
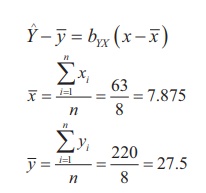
The regression equation of Y on X,
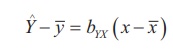
ˆY – 27.5 = 2.098 (x – 7.875)
ˆY – 27.5 = 2.098 x – 16.52
ˆY = 2.098x + 10.98
When x = 15
ˆY = 2.098 × 15 +10.98
Y = 31.47 + 10.98
= 42.45
Regression equation of X on Y,

The regression equation of X on Y,
ˆX – 7.875 = 0.169 (y – 27.5)
ˆX – 7.875 = 0.169y – 0.169 × 27.5
ˆX = 0.169y + 3.222
Example 5.5
The random sample of 5 school students is selected and their marks
in statistics and accountancy are found to be
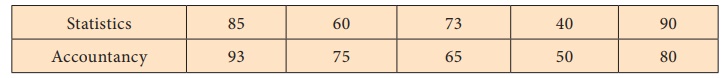
Find the two regression lines.
Solution:
The two regression lines are:
Regression equation of Y on X,
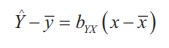
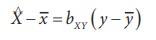
Regression equation of X on Y,
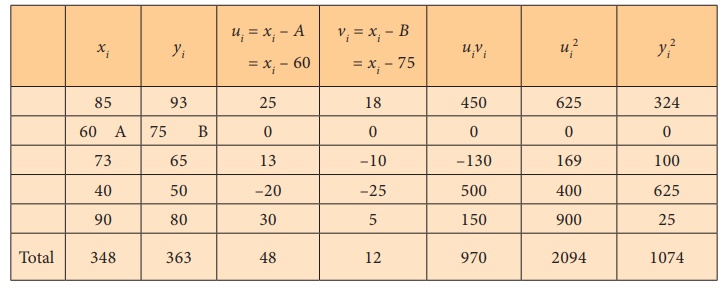
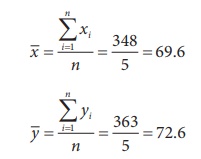
Since the mean values are in decimals format not as integers and
numbers are big, we take origins for x and y and then solve the
problem.
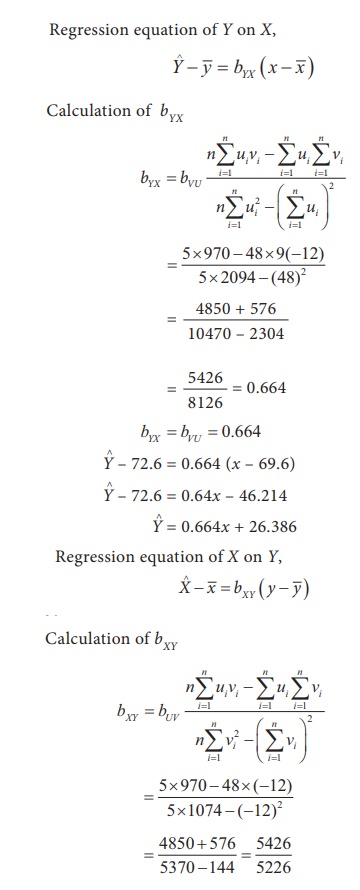
Regression equation of Y on X,
bUV = 1.038
ˆX – 69.6 = 1.038 (y – 72.6)
ˆX – 69.6 = 1.038y – 75.359
ˆX = 1.038y – 5.759
Example 5.6
Is there any mistake in the data provided about the two regression
lines Y = −1.5 X + 7, and X = 0.6 Y + 9? Give
reasons.
Solution:
The regression coefficient of Y on X is bYX
= –1.5
The regression coefficient of X on Y is bXY
= 0.6
Both the regression coefficients are of different sign, which is a
contrary. So the given equations cannot be regression lines.
Example: 5.7
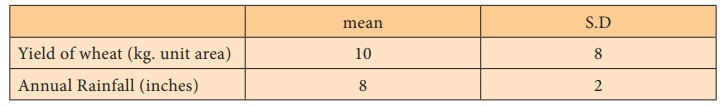
Correlation coefficient: 0.5
Estimate the yield when rainfall is 9 inches
Solution:
Let us denote the dependent variable yield by Y and the
independent variable rainfall by X.
Regression equation of Y on X is given by
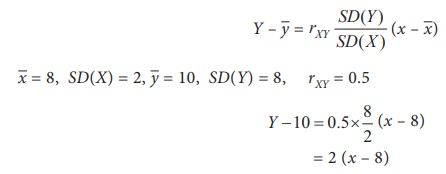
When x = 9,
Y – 10 = 2 (9 – 8)
Y = 2 + 10
= 12 kg (per unit area)
Corresponding to the annual rain fall 9 inches the expected yield
is 12 kg ( per unit area).
Example 5.8
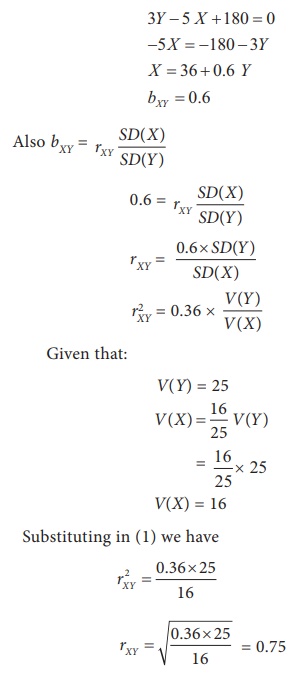
For 50 students of a class the regression equation of marks in
Statistics ( X) on marks in Accountancy (Y) is 3Y – 5X
+ 180 = 0. The mean marks in of Accountancy is 50 and variance of marks in
statistics is 16/25 of the variance of marks in Accountancy.
Find the mean marks in statistics and the coefficient of
correlation between marks in the two subjects when the variance of Y is
25.
Solution:
We are given that:
n = 50, Regression equation of X on Y as 3Y – 5X
+ 180 = 0
![]() = 50 , V (X) = 16/25 V (Y ) , and V(Y) = 25.
= 50 , V (X) = 16/25 V (Y ) , and V(Y) = 25.
We have to find (i) ![]() and
(ii) rXY
and
(ii) rXY
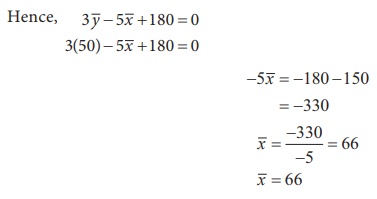
(i) Calculation for ![]()
Since (![]() ,
,![]() ) is the point of
intersection of the two regression lines, they lie on the regression line 3Y
– 5X + 180 = 0
) is the point of
intersection of the two regression lines, they lie on the regression line 3Y
– 5X + 180 = 0
(ii) Calculation for coefficient of correlation.
3Y - 5 X + 180 = 0
- 5 X = - 180 - 3Y
Example 5.9
If two regression coefficients are bYX = 5/6 and
bXY =
9/20 , what would be the value of rXY?
Solution:
The correlation coefficient rXY =
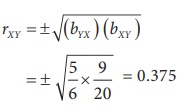
Since both the signs in bYX and bXY
are positive, correlation coefficient between X and Y is
positive.
Example 5.10
Given that bYX = 18/7 and bXY = -5/6 . Find
r ?
Solution:
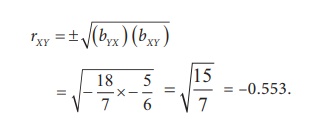
Since both the signs in bYX and bXY
are negative, correlation coefficient between X and Y is
negative.
Related Topics