Chapter: 12th Statistics : Chapter 5 : Regression Analysis
Definition and Types of Regression
DEFINITION
Regression analysis is a statistical method of determining the
mathematical functional relationship connecting independent variable(s) and a
dependent variable.
Types of ‘Regression’
Based on the kind of relationship between the dependent variable
and the set of independent variable(s), there arises two broad categories of
regression viz., linear regression and non-linear regression.
If the relationship is linear and there is only one independent
variable, then the regression is called as simple linear regression. On the
other hand, if the relationship is linear and the number of independent
variables is two or more, then the regression is called as multiple linear
regression. If the relationship between the dependent variable and the
independent variable(s) is not linear, then the regression is called as
non-linear regression.
1. Simple Linear Regression
It is one of the most widely known modeling techniques. In this
technique, the dependent variable is continuous, independent variable(s) can be
continuous or discrete and nature of relationship is linear. This relationship
can be expressed using a straight line equation (linear regression) that best
approximates all the individual data points.
Simple linear regression establishes a relationship between a dependent variable ( Y) and one independent variable (X) using a best fitted straight
line (also known as
regression line).
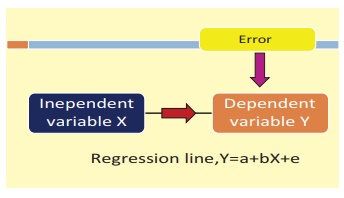
The general form of the simple linear regression equation is Y
= a + bX + e, where ‘X’ is
independent variable, ‘Y’ is dependent variable, a’ is intercept,
‘b’ is slope of the line and ‘ e’ is error term. This equation
can be used to estimate the value of response variable (Y) based on the
given values of the predictor variable (X) within its domain.
2. Multiple Linear Regression
In the case of several independent variables, regression analysis
also allows us to compare the effects of independent variables measured on
different scales, such as the effect of price changes and the number of
promotional activities.
Multiple linear regression uses two or more independent variables
to estimate the value(s) of the response variable (Y).
The general form of the multiple linear regression equation is Y
= a + b1X1 +
b2X2 + b3X3
+ ... + btXt + e
Here, Y represents the dependent (response) variable, Xi
represents the ith independent variable (regressor), a
and bi are the regression coefficients and e is the
error term.
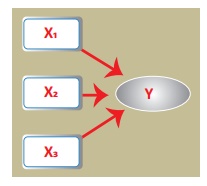
Suppose that price of a product (Y) depends mainly upon
three promotional activities such as discount (X1),
instalment scheme (X2) and free installation (X3).
If the price of the product has linear relationship with each promotional
activity, then the relationship among Y and X1, X2
and X3 may be expressed using the above general form as
Y = a + b1 X 1 + b2 X 2 + b3 X 3 + e .
These benefits help market researchers / data analysts / data
scientists to eliminate and evaluate the best set of variables to be used for
building regression models for predictive purposes.
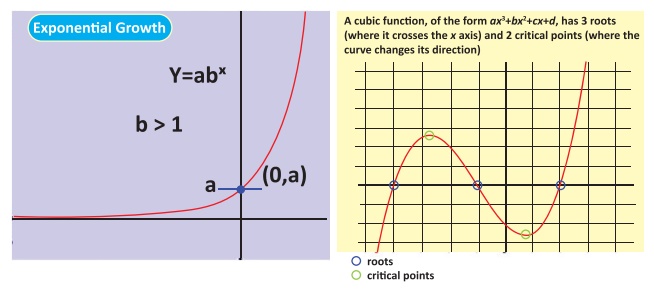
3. Non-Linear Regression
If the regression is not linear and is in some other form, then
the regression is said to be non-linear regression. Some of the non-linear
relationships are displayed below.
Related Topics