Chapter: Optical Communication and Networking : Fiber Optic Receiver and Measurements
Probability of Error
PROBABLITY OF ERROR
· The digital receiver performance can be evolved by measuring of error and quantum limit.
· In practice, several standard ways are available to measuring the rate of error occurences in a digital data stream.
· Bit error rate or the error rate [BER]
Bit error rate is defined by the ratio between number of errors (Ne) occurring over a certain time interval t to the number of error (Nt) during this interval.
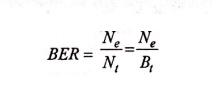
Where B=1/Tb is the bit rate (is the pulse transmission rate).
· The error rates the optical fiber telecommunication system range from 10-9 to 10-12.
· The probability distribution of signal at the equalizer output should be known to compute BER. Here the decision is made as to whether a 0 or a 1 is sent.
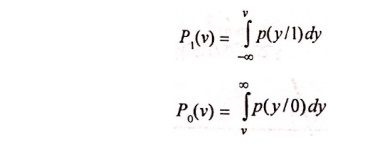
P1 (v) is the probability that the equalizer output voltage is less than v when log”1” is sent.
P0 (v) is the probability that the equalizer output voltage exceeds “v” when logic ‘o’ is sent.
· The figure shows the probability distribution for received logic 0 and 1.The function P(y/1) and P(y/0) are the conditional probability distribution functions, that is P(y/x) is the probability that the output voltage is y, given that an x was transmitted.
· If the threshold voltage is vth then the error probability Pe is defined as
· The weighing factors a and b determined by the priori distribution of the data and b are the probabilities that either a 1 or 0 occurs.
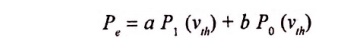
· To calculate the “pe”, the mean and standard deviation of the output voltage Vout (t) should be known.
· Thus, let us assume that a signal S (Which can be either a noise disturbance or a desired information bearing signal) has a Gaussian probability distribution function with a mean value m.
· Now, we can use the probability density function to determine the probability of error for a data stream in which the 1 pulse are all of amplitude V.
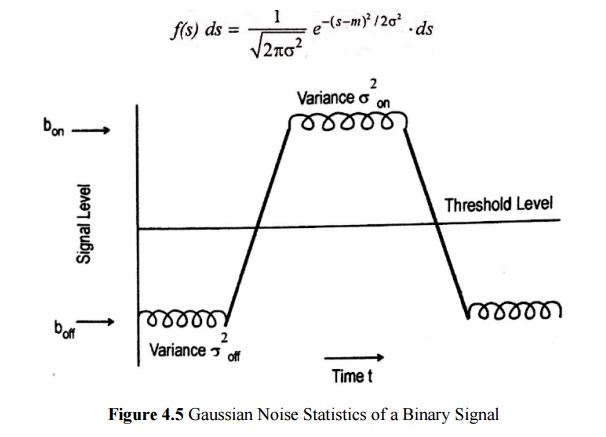
· The above figure shows, the mean and variance of the Gaussian output for a 1 pulse are bon and σon2, respectively, whereas for a 0 pulse they are boff and σoff2, respectively.
PROBABILITY OF ERROR WHEN 0 PULSE SENT
· Let us first consider the case of o pulse being sent. So that no pulse is present at the decoding time. The probability that noise will exceed the threshold voltage vth and be 1 pulse.
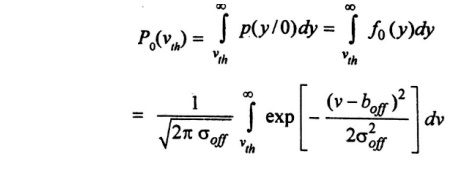
· Where the subscript 0 denotes the presence of a 0 bit.
PROBABILITY OF ERROR WHEN 1 PULSE SENT
· Transmitted pulse 1 is misinterpreted as a o by the electronics following the equalizer.
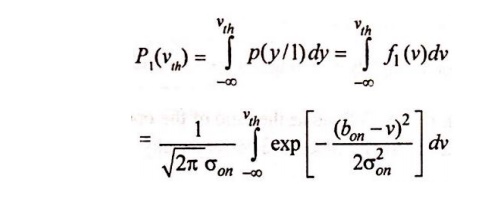
Where the subscript 1 denotes the presence of a 1 bit.
Related Topics