Chapter: XML and Web Services : Building XML-Based Applications : Interactive Graphical Visualizations with SVG
Powering Web Pages with SVG
Powering Web Pages with SVG
This section discusses how to embed SVG graphics in Web pages and then
how to make these graphics interactive in order to deliver interactive
graphical visualizations over the Web.
Embedding SVG Graphics in Web Pages
Listing 12.7 shows an XHTML Web page with an embedded SVG diagram. To
view SVG diagrams, including the one in this example, in your Web browser you
must first install a plug-in capable of rendering SVG—for example, the SVG
Viewer from Adobe at www.adobe.com/svg/viewer/install.
LISTING 12.7 3MonthLoan.htm—Sample Loan XHTML
<html>
<head>
<title>Loan
Visualization</title> </head>
<body>
<embed
src=”3MonthLoan_WithCss.svg”
width=”485” height=”290”
➥ type=”image/svg-xml” border=”1”
➥ pluginspage=”http://www.adobe.com/svg/viewer/install/main.html” />
</body>
</html>
The key element in this Web page is the embed element, shown here:
<embed
src=”3MonthLoan_WithCss.svg”
width=”485” height=”290”
➥ type=”image/svg-xml” border=”1”
➥ pluginspage=”http://www.adobe.com/svg/viewer/install/main.html” />
The value of the src
attribute of the embed element provides the URL for the SVG docu-ment to embed in the Web
page. In this case, the SVG document is in the same directory on the Web
content tree as the Web page in which it is embedded. The width and height attributes, on the other hand,
define the dimensions of the SVG embedded diagram. The type attribute gives the MIME content
type of the embedded SVG diagram (in this case,
image/svg-xml). The SVG diagram has a border
of 1 pixel, as defined by the border element. In the event that the Web browser viewing the Web page does not
have the capability to view documents of type image/svg-xml, the pluginspage attribute defines the Web page on the Internet to which the Web browser
user may go to get an appropri-ate plug-in to view the embedded SVG document.
In this case, the user is directed to the Adobe Web site (www.adobe.com) to get the Adobe SVG Viewer Web
browser plug-in.
Adding Interactive Behavior
Another key advantage of SVG over other vector graphics formats is the
ability to add interactive behavior to SVG diagrams. This section looks at a small
cross section of types of behavior that may be added to an SVG diagram to make
it interactive, including those listed here:
Scaling
Panning
Highlighting
Descriptions
Analysis
For each type of behavior, code snippets are given in this discussion.
These snippets are additions to the various documents already presented in this
section in order to give them the desired interactive behavior. The complete
resulting documents created by adding all the interactive behavior discussed
here may be downloaded from the Web site resource center for this book. Refer
to these files to see how the code snippets in this section fit into the
overall loan application. You may also load the file named 120MonthLoan_Advanced.htm in your
Web browser to try out the interactive behavior. The complete documents with all the interactive behavior discussed in
this section include the following:
120MonthLoan.xml. An XML loan document for a 120-month loan
Loan_Advanced.xsl. An XSL style sheet used to transform an XML loan docu-
ment to get an SVG visualization
120MonthLoan_Advanced.svg. An SVG visualization of a 120-month loan
120MonthLoan_Advanced.htm. An XHTML document with embedded SVG visual-
ization of a 120-month loan suitable for delivery
over the Web
• 120MonthLoan_Advanced.xsl. An XSL-FO document with an embedded SVG visualization of a 120-month loan suitable for printing
Scaling
Scaling changes the zoom factor of the diagram. This enables the user to
either zoom in for a magnified look at a subset of the diagram or to zoom out
for an overview of the entire diagram. It is useful to enable the user to
progressively change the zoom factor by a fixed delta. To implement this, we
first add a form with the following input fields to the XHTML document in
Listing 12.7:
<input type=”button” value=” - “ onclick=”scale( scaleFactor - ➥ scaleFactorDelta )” />
<input type=”button” value=” + “ onclick=”scale( scaleFactor + ➥ scaleFactorDelta )” />
It is also useful to enable the user to change the zoom factor directly
to an explicitly specified value, as shown here:
<input name=”scaleFactorTextField” type=”text” value=”1.0” size=”3”
/> <input type=”button” value=”Ok” onclick=”scale(
➥ this.form.scaleFactorTextField.value
)” />
These input fields catch the onclick event and make a JavaScript callback to the scale function in response. The value
passed to the scale function is the new zoom factor, which is computed from two JavaScript
variables also added to the same document and shown here:
var scaleFactor = 1.0;
var scaleFactorDelta = 0.1;
The scaleFactor variable holds the value of the current scale factor, whereas the scaleFactorDelta variable is the progressive
change in the scale factor when the user is zooming in or out.
The scale function implements the interactive scaling behavior, as shown here:
function scale( newScaleFactor )
{ scaleFactor = newScaleFactor; scaleFactorTextField.value = newScaleFactor;
updateSvgLoanPlot();
}
This function updates the current scale factor and reflects that value
in the text field in the XHTML GUI. It then updates the SVG diagram with a call
to the following function:
function updateSvgLoanPlot() {
svgLoanPlot.setAttribute( “transform”, “scale(“ +
scaleFactor + “) ➥ translate(“ + plotX + “,” +
plotY + “)” );
}
This function sets an attribute named transform on an element in the SVG DOM to a value that contains a scale transformation with the new
scale factor. This element corre-sponds to the single child “group” element,
named g, in the
SVG DOM, as shown here:
<svg height=”290” width=”485”
xmlns:xlink=”http://www.w3.org/1999/xlink”> <g transform=”scale(1.0)
translate(0,0)” id=”LoanPlot”>
...
</g>
</svg>
The g element
groups all the vector graphics elements of the SVG loan plot. Therefore,
applying a scale transformation to this element causes the scale factor to be
applied to every element in the SVG diagram. The JavaScript variable svgLoanPlot, which corre-sponds to the SVG g element discussed previously, is
initialized when the Web page is loaded, as shown here:
svgDoc = document.embeds[ 0 ].getSVGDocument(); svgLoanPlot =
svgDoc.getElementById( “LoanPlot” );
Note that the ID of the g element
is LoanPlot. Also,
note how this is used to locate the element in the SVG DOM. This technique may
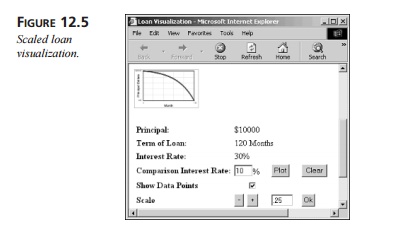
be used to locate other elements in the DOM with different IDs as well. Figure
12.5 shows a screenshot of the SVG diagram with a scale factor of 0.25 applied, causing a reduction in
the size of the diagram to one quarter its default size. It is also possible to
scale subsections of the SVG diagram through other vector graphic element
groupings. Note that the default scale factor is 1.0, corresponding to no scaling. This type of interactive behavior is
particularly important in SVG applications in the field of mapping. In these
types of applications, the amount of detail visible in the diagram is changed
according to the level of magnification of the diagram. For example, at the
highest zoom factor, street names may not be shown because they would be too
small to be legible anyway and would obscure other higher-level detail. For
details of how to toggle the visibility of elements, see the upcoming
sub-section titled “Highlighting.” Note that other transformations are
possible, including rotations and translations, as discussed in the following
subsection. For a complete list of possible transformations, see the SVG
specification at www.w3.org.
Panning
Panning involves the movement of all or part of the SVG diagram up,
down, left, or right (or some combination thereof). This type of interactive
behavior is particularly useful in combination with scaling, discussed
previously. For example, on an SVG diagram where the user has zoomed in for a
detailed look at part of the diagram, panning may be used to “move around” in
order to look in detail at different parts of the SVG diagram. The fol-lowing
button controls may be added to the XHTML shown in Listing 12.7 in order to
enable the user to perform the panning:
<input type=”button” value=” Up “ onclick=”pan( plotX, plotY -
panDelta )” /> <input type=”button” value=” Left “ onclick=”pan( plotX -
panDelta, plotY )” /> <input type=”button” value=” Zero “ onclick=”pan(
0, 0 )” />
<input type=”button” value=”Right” onclick=”pan( plotX + panDelta,
plotY )” /> <input type=”button” value=”Down” onclick=”pan( plotX, plotY
+ panDelta )” />
When the user clicks one of these buttons, the onclick event is caught and new x and y
coordinates for the translation are computed from the three JavaScript
variables shown here:
var plotX = 0; var plotY = 0;
var
panDelta = 25;
In this case, plotX and plotY values of 0 indicate
no translation, and the SVG diagram is in its original position, where it first
renders. The variable panDelta is the change in pix-els applied to either the plotX or the plotY coordinate for each step that
the user pans.
Once the new values have been computed, a call is
made to the JavaScript pan
function, shown here, to update the SVG diagram:
function pan( newPlotX, newPlotY
) { plotX = newPlotX;
plotY = newPlotY; updateSvgLoanPlot();
}
Once the plotX and plotY coordinates have been updated, a call is made to the updateSvgLoanPlot function, shown previously in the
discussion on scaling behavior. This
changes the transformation applied to the SVG diagram to include the desired
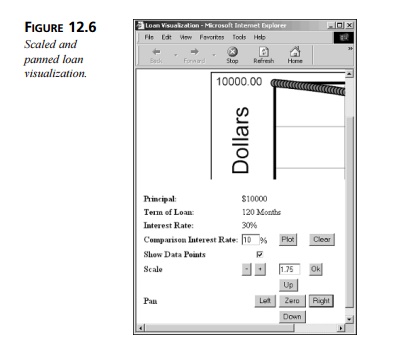
pan-ning. Figure 12.6 shows the SVG loan visualization with a scale factor of 1.75 applied, together with some
panning, to show the first few data points of the plot.
Highlighting
In this discussion, highlighting
behavior means toggling the visibility of SVG vector graphics elements. In
this example, we show how the circles representing the data points in the plot
may be toggled on or off so that they are either visible or invisible. A
check-box may be added to the XHTML in Listing 12.7, as shown here, to enable
users to tog-gle data points on or off:
<input type=”checkbox” name=”showDataPoints” value=”on”
checked=”true”
➥ onclick=”setDataPointVisibility(
this.form.showDataPoints.checked
)” />
When the user either checks or unchecks this box, the onclick event is caught and the
JavaScript function setDataPointVisibility is invoked:
function setDataPointVisibility(
showDataPoints ) { var visibility = “hidden”;
if( showDataPoints ) { visibility
= “visible”;
}
for( var i = 0; i <=
loanTermInMonths; ++i ) { svgPaymentDataPoint = svgDoc.getElementById( “Month”
+ i ); svgPaymentDataPoint.setAttribute( “visibility”, visibility );
}
}
Just as the g (group)
element was used in the previous discussions on scaling and pan-ning, it can
also be used for highlighting. Each of the data points represented by circle elements in the SVG may be
contained by a g element,
as shown here:
<g
onmousedown=”showPayment(0,
0.00, 0.00, 263.62,
10000.00 )”>
<circle class=”datapoint” visibility=”visible”
r=”4” id=”Month0” cx=”68.5” ➥ cy=”11.7”/>
</g>
The setDataPointVisibility function, shown previously, first determines whether the data points
are being turned on or off and stores the result in the visibility variable. It then loops over
each data point over the duration of the loan stored in the loanTermInMonths variable, which is initialized
when the Web page is loaded (in this case, to the value 120). For
each data point X, it
looks up the g element
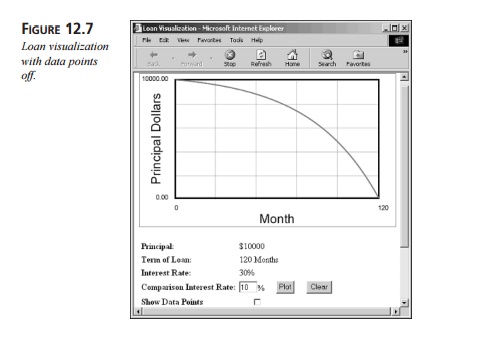
with the ID MonthX, as shown in the SVG for Month0. The function then sets the attribute named visibility on this g element to either visible or hidden, depending on whether the data points are being turned on or off, respectively. Figure 12.7 shows
the SVG loan dia-gram with all the data points turned off. This is another good
example of how the SVG DOM may be manipulated by JavaScript functions to
provide interactive behavior. This type of interactive behavior is particularly
useful in SVG diagrams that include the con-cept of layering (for example, maps
where the user may want to either view or hide a certain set of features in a
layer, depending on how she is using the SVG diagram) .
Descriptions
This type of interactive behavior involves the user selecting an element
of the SVG dia-gram to view more detailed information. To illustrate this
concept with our loan example, we will enable the user to select any loan
payment data point on the plot to view details for that payment, including the
index of the month, the principal and interest components of the payment, the
total payment, and the balance of the outstanding principal at the point of the
payment. In this case, the event of the user clicking a component of the SVG
diagram is caught by the payment data point of the SVG diagram, as shown here:
<g
onmousedown=”showPayment(1,
13.62, 250.00, 263.62,
9986.38 )”>
<circle class=”datapoint” visibility=”visible”
r=”4” id=”Month1” cx=”71.7” ➥ cy=”12.0”/>
</g>
The g element
enclosing the circle element used to represent the data point has an attribute, onmousedown, that traps a user click on the
data point and calls the JavaScript showPayment
function, shown here, in response:
function showPayment( month, principalPayment, interestPayment,
totalPayment, ➥ principalOutstanding ) {
alert(
“Month: “ +
month + “\n”
+ “Principal Payment:
$” + principalPayment
➥ + “\n” + “Interest Payment: $” + interestPayment + “\n” ➥ + “Total Payment: $” + totalPayment + “\n”
➥ + “Principal Outstanding:
$” + principalOutstanding );
}
This function is in the XHTML document shown in Listing 12.7, in which
the SVG dia-gram is embedded. The arguments to this function are the values of
the detailed informa-tion for the data point. This function simply creates a
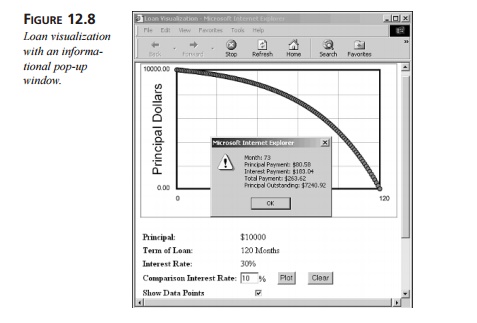
JavaScript alert to show the detailed information for the data point in a
pop-up window, as shown in Figure 12.8.
This type of interactive behavior is very important in a broad range of
visualizations for which there may be a vast amount of associated information,
but displaying it all at once would lead to too much information for the user
to assimilate. Enabling the user to inter-actively request the specific
information he is interested in helps the SVG visualization stay clean and
effective.
Analysis
In many interactive applications, the user is presented with information
that she wishes to analyze (for example, by testing a few “what-if” scenarios
and immediately seeing the effect). In our loan example, we illustrate this by
enabling the user to specify an alterna-tive interest rate for her loan and
have the visualization plot a curve showing the perfor-mance of the loan with
the new interest rate, together with the original plot for comparison. The
first step in this interaction is to acquire the new interest rate from the
user—for example, by adding the form input fields shown here to the XHTML
docu-ment shown in Listing 12.7:
<input name=”comparisonInterestRateTextField” type=”text” value=”10” ➥ size=”2” />%
<input type=”button” value=”Plot”
➥ onclick=”plot( comparisonInterestRateTextField.value )” /> <input
type=”button” value=”Clear” onclick=”clearPlot()” />
The first input field, named comparisonInterestRateTextField, is the text field in which the user types the new interest rate she
wishes to try. The next input field is a but-ton labeled Plot that the user clicks to initiate
the plotting of the loan performance for the new interest rate. Note that when
the user selects this button, the form is not being submitted to a server.
Rather, the onclick event for the button is caught and the JavaScript function named plot, which is embedded in the XHTML
document contain-ing the SVG diagram, is invoked with the value of the new test
interest rate. The last input in the form is another button, labeled Clear,
that enables the user to clear a “what-if” test case plot. Similarly, this
button causes the JavaScript clearPlot function to be invoked. The plot function is shown here:
function plot( interestRate
) {
var
monthlyInterestRate = (
interestRate / 100.0
) / 12.0;
var monthlyPayment = round( principal * ( monthlyInterestRate / ( 1.0 - ➥ Math.pow( 1.0 + monthlyInterestRate, -loanTermInMonths ) ) ) );
var outstandingPrincipal = principal; var
dataPoints = “”;
for( var i = 0; i <=
loanTermInMonths; ++i ) { var interestPayment = 0.00;
var principalPayment = 0.00; if( i > 0 ) {
interestPayment = round( outstandingPrincipal *
monthlyInterestRate ); principalPayment = round( monthlyPayment -
interestPayment );
}
outstandingPrincipal =
outstandingPrincipal - principalPayment;
testDataPointGroups[
i ].setAttribute( “onmousedown”,
“alert(
‘“ +
“Month:
“ + i
+ “\\n” +
“Principal Payment: $” + principalPayment + “\\n” +
“Interest Payment: $” + interestPayment + “\\n” + “Total Payment: $” +
monthlyPayment + “\\n” +
“Principal Outstanding: $” + round(
outstandingPrincipal ) + “‘ )” );
var cx = plotTopLeftX + ( i * ( plotWidth /
loanTermInMonths ) ); testDataPoints[ i ].setAttribute( “cx”, cx );
var cy = plotTopLeftY + ( plotHeight - ( plotHeight
/ principal ) * ➥ outstandingPrincipal );
testDataPoints[
i ].setAttribute( “cy”,
cy );
testDataPoints[
i ].setAttribute( “visibility”,
“visible” );
dataPoints
+= “ “
+ cx +
“,” + cy;
}
testDataLine.setAttribute( “points”, dataPoints );
testDataLine.setAttribute( “visibility”, “visible” );
}
The first step in this function is to compute the monthly interest rate
and loan payment from the given annual interest rate using the formulas
presented earlier in this chapter. For each month in the term of the loan, this
function computes the principal, interest, and total monthly payments, rounded
to the nearest cent, using the simple round function shown here:
function round( x
) {
return
Math.round( x *
100.0 ) /
100.0;
}
The detailed information for each loan payment is then set in the SVG
DOM in order to show the loan performance for the new interest rate. In this
case, the elements of the DOM that are affected are stored in the testDataPointGroups array, which is initialized when
the Web page is first loaded, as shown here:
testDataLine = svgDoc.createElement( “polyline” );
testDataLine.setAttribute( “class”, “analysisData” );
testDataLine.setAttribute( “visibility”, “hidden” ); svgLoanPlot.appendChild(
testDataLine );
for( var i
= 0; i <= loanTermInMonths; ++i
) {
var testDataPoint = svgDoc.createElement( “circle”
); testDataPoint.setAttribute( “id”, “TestMonth” + i );
testDataPoint.setAttribute( “visibility”, “hidden” );
testDataPoint.setAttribute( “r”, “4” ); testDataPoint.setAttribute( “cx”, “10”
); testDataPoint.setAttribute( “cy”, “10” ); testDataPoint.setAttribute(
“class”, “analysisDatapoint” );
var testDataPointGroup = svgDoc.createElement( “g”
); testDataPointGroup.appendChild( testDataPoint );
svgLoanPlot.appendChild( testDataPointGroup );
testDataPoints[ i ] = testDataPoint; testDataPointGroups[
i ] = testDataPointGroup;
}
This initialization creates a new polyline element as well as a g element
that encloses a circle element for each loan payment data point. The attributes that are set on
these ele-ments are similar to those for the current loan interest rate already
discussed, with the important exception of the visibility attribute, which is set to a value of hidden to ensure that the elements of the test plot are not visible until the
user tries a “what-if” sce-nario by specifying a new interest rate. Lastly, the
new polyline and g elements are appended as
children of the svg root
element node in the DOM that is represented by the svgLoanPlot variable.
Given the initialization of our testDataLine and testDataPointGroups variables, as discussed earlier, the plot function listed previously
modifies the attributes of these ele-ments in order to show loan performance
for any specified interest rate. In particular, the cx and cy attributes of the circle elements, representing the coordinates of the center of the circles, are modified to move
the data points into the correct positions in the plot to reflect the new
interest rate. The visibility attribute of each circle is also set to a value of visible to make its data point visible. Recall
that the plot is composed not only of data points but also a multisegment line
represented as a polyline element in the SVG DOM. Similarly, this element is created during
initialization and is set during a call to the plot function to reflect loan performance for a new interest rate. In this
case, it is the points and visibility attributes of the polyline element represented by the
testDataLine variable that are set to show the
new multisegment line in the correct loca-tion on the plot and make it visible,
respectively.
To clear a test plot for a new interest rate, the user clicks the form
button labeled Clear (presented previously). This results in a callback to the clearPlot JavaScript function listed here:
function clearPlot() {
testDataLine.setAttribute( “visibility”, “hidden”
); for( var i = 0; i <= loanTermInMonths; ++i ) {
testDataPoints[
i ].setAttribute( “visibility”,
“hidden” );
}
}
This function simply sets the values of the visibility attributes of each of the test
data point circles and the underlying multisegment lines to a value of hidden in order to make them invisible.
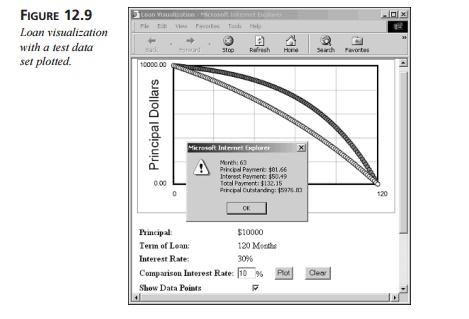
Figure 12.9 shows an SVG loan visualization with a plot of our default
30-percent interest rate, together with a plot for a test interest rate of 10
percent. In this case, the user has clicked the test plot to get a pop-up
window with detailed information on one of the data points, as discussed
previously.
This important example shows that interactive SVG visualizations may be
realized not only by modifying attributes on existing elements in the SVG DOM,
as shown previ-ously, but also by adding new elements to the SVG DOM, as shown
here. In fact, it is also possible to delete elements of the SVG DOM, although
doing this would have the same visible effect as making the element invisible,
as discussed previously. This exam-ple also shows how the user may change the
SVG visualization interactively in an arbi-trary way in response to input to
realize any kind of interactive behavior. This flexible yet simple-to-use
capability paves the way for powerful, new interactive visualizations using
SVG. The next few subsections outline some of the key advantages of using SVG
to add visualizations to content.
The Benefits of Web Pages Powered by SVG
SVG enables powerful and compelling visualizations to be created. This
enables Web pages to be more interactive and engaging for the user. Although in
many cases it is pos-sible to understand concepts through static information
only, for many situations we learn more rapidly by manipulating items and
viewing responses to our actions. Such sit-uations indicate good potential
target applications for interactive SVG visualizations.
Faster Client Response Time
Many Web applications today are made pseudo-interactive through the use
of client/server interaction. In this case, when the user performs some action
on a Web page, the Web browser sends a request to the Web server to get another
Web page that reflects the changes
associated with the user action. In practice, this approach results in
unpredictable and frustrating application behavior, especially when the
client/server interaction is occurring over a network without any guarantee of
quality of service—a prime example of which is the Internet. In such cases, any
user action is followed by a frustrating wait while the updated Web page is
loaded. In the case of SVG, however, it is possible to realize true interactive
behavior completely on the client side without any net-work requests to the
server after the initial loading of the Web page containing the visu-alization.
In practice, this leads to significantly faster client response time and more
user-friendly interactive content.
Reduced Server Load
Because content that is interactive completely on the client side
(without server interac-tion beyond initial loading) does not require
subsequent server requests to deliver inter-active behavior, there is less
demand on the server. This enables both improved performance for existing
clients and improved ability to scale to service more clients.
Improved User Privacy
Many useful interactive applications involve the user entering and
manipulating sensitive information (for example, financial information
associated with a loan).
Where applications are pseudo-interactive, as defined earlier, this
information needs to be exchanged with the server. Where the network connection
between the client Web browser and target Web server is secured with HTTPS,
some assurance is given to users that their sensitive information will not be
compromised while in transit over the public, untrusted Internet. However, in
many of these applications, this assurance may not be enough to engage users
because they may not even want their sensitive information to propagate to the
target Web server, where they fear it will be compromised or used against them
(for marketing purposes, for example).
SVG, however, enables completely client-side interactive behavior that
allows users to enter and interact with their sensitive information totally on
the client side with no need to share this information with the server. This
enables users to gain a better understand-ing of their options and make
decisions before opting to share their sensitive information, such as in the
case of a loan application.
Related Topics