Chapter: XML and Web Services : Building XML-Based Applications : Interactive Graphical Visualizations with SVG
Creating an SVG Content Presentation Prototype
Creating an SVG Content Presentation Prototype
Given the sample XML loan document in Listing 12.2, the next step is to
create a sample SVG visualization of this loan. Although given a thorough
knowledge of SVG it is possi-ble to create such a visualization manually, in
practice the fastest and easiest way to cre-ate such a visualization is to use
a WYSIWYG (What You See Is What You Get) SVG editor, such as JASC WebDraw (www.jasc.com). The XML document created using
such a tool may then be fine-tuned by hand to get the exact desired result. The
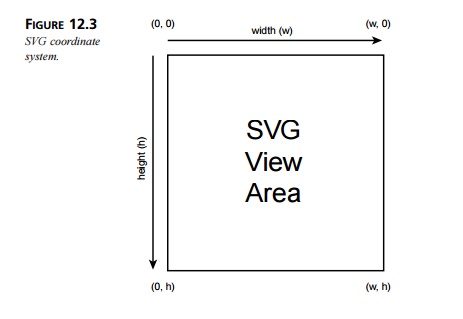
coordinate sys-tem used by SVG is shown in Figure 12.3. Note, in particular,
the orientation of the y axis so that a y coordinate of zero is at the “top” of
the coordinate system and increases downwards. The default units of this
coordinate system, when no units are specified, are pixels (px). SVG does,
however, enable coordinates to be explicitly specified in a variety of other
units, including inches (in), millimeters (mm), and centimeters (cm). The unit
of a given measurement or coordinate can be specified explicitly by appending
the associ-ated two-letter suffix to the number.

Listing 12.3 shows the prototype SVG document created for the XML loan
document shown in Listing 12.2 using JASC WebDraw editor (www.jasc.com). You are encouraged to download
and install WebDraw and then load the SVG in Listing 12.3 to get a hands-on
feeling for editing SVG.
LISTING 12.3 3MonthLoan.svg—Sample Loan SVG
<?xml version=”1.0” standalone=”no”?> <!DOCTYPE svg PUBLIC
“-//W3C//DTD SVG 1.0//EN”
➥ ”http://www.w3.org/TR/2001/REC-SVG-20010904/DTD/svg10.dtd”> <svg
width=”485” height=”290”>
<rect x=”0” y=”0” width=”485” height=”290”
stroke=”rgb(0,0,0)” ➥ stroke-width=”1”
fill=”none”/>
<rect x=”68.5” y=”11.7” width=”384” height=”224”
stroke=”rgb(0,0,0)” ➥ stroke-width=”3”
fill=”none”/>
<line x1=”67” y1=”58.8” x2=”451” y2=”58.8”
fill=”none” stroke=”rgb(0,0,0)” ➥ stroke-width=”1”
stroke-opacity=”0.25”/>
<line x1=”67” y1=”103.6” x2=”451” y2=”103.6”
fill=”none” stroke=”rgb(0,0,0)” ➥ stroke-width=”1” stroke-opacity=”0.25”/>
<line x1=”67” y1=”148.4” x2=”451” y2=”148.4”
fill=”none” stroke=”rgb(0,0,0)” ➥ stroke-width=”1”
stroke-opacity=”0.25”/>
<line x1=”67” y1=”193.2” x2=”451” y2=”193.2”
fill=”none” stroke=”rgb(0,0,0)” ➥ stroke-width=”1”
stroke-opacity=”0.25”/>
<line x1=”143.8” y1=”14” x2=”143.8” y2=”238” fill=”none”
stroke=”rgb(0,0,0)” ➥ stroke-width=”1”
stroke-opacity=”0.25”/>
<line x1=”220.6” y1=”14”
x2=”220.6” y2=”238” fill=”none” stroke=”rgb(0,0,0)” ➥ stroke-width=”1” stroke-opacity=”0.25”/>
<line x1=”297.4” y1=”14”
x2=”297.4” y2=”238” fill=”none” stroke=”rgb(0,0,0)” ➥ stroke-width=”1” stroke-opacity=”0.25”/>
<line x1=”374.2” y1=”14”
x2=”374.2” y2=”238” fill=”none” stroke=”rgb(0,0,0)” ➥ stroke-width=”1” stroke-opacity=”0.25”/>
<text
x=”10px” y=”155px” transform=”rotate(-90) translate(-220,-115)”
➥ fill=”rgb(0,0,0)”
font-family=”Arial” font-size=”24”>Principal Dollars</text> <text
x=”227.08px” y=”283.289px” fill=”rgb(0,0,0)” font-size=”24”
➥ font-family=”Arial”>Month</text>
<text x=”67px” y=”258.072px”
fill=”rgb(0,0,0)” font-family=”Arial” ➥ font-size=”12”>0</text>
<text x=”55px” y=”238px”
fill=”rgb(0,0,0)” text-anchor=”end” ➥ font-family=”Arial”
font-size=”12”>0.00</text>
<text x=”451px” y=”258.072px”
fill=”rgb(0,0,0)” font-family=”Arial” ➥ font-size=”12”>3</text>
<text x=”55px” y=”14px”
fill=”rgb(0,0,0)” text-anchor=”end” ➥ font-family=”Arial”
font-size=”12”>10000.00</text>
<polyline fill=”none”
stroke=”rgb(255,0,0)” stroke-width=”2” ➥ points=”68.5,11.7 196.5,85.87
324.5,160.53 452.5,235.7”/>
<circle cx=”68.5” cy=”11.7”
r=”4” fill=”rgb(255,0,0)” stroke=”rgb(0,0,0)” ➥ stroke-width=”1”/>
<circle cx=”196.5” cy=”85.87”
r=”4” fill=”rgb(255,0,0)” stroke=”rgb(0,0,0)” ➥ stroke-width=”1”/>
<circle cx=”324.5” cy=”160.53”
r=”4” fill=”rgb(255,0,0)” stroke=”rgb(0,0,0)” ➥ stroke-width=”1”/>
<circle cx=”452.5” cy=”235.7”
r=”4” fill=”rgb(255,0,0)” stroke=”rgb(0,0,0)” ➥ stroke-width=”1”/>
</svg>
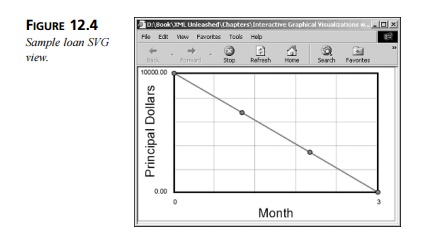
Figure 12.4 shows a screenshot of the SVG loan
prototype diagram that appears in Listing 12.3. Key aspects of this SVG
prototype are discussed subsequently.
The svg root element shown below contains the entire vector graphics diagram
and defines its width and height in pixels.
<svg
width=”485” height=”290”>
The first child rect element shown below defines the bounding box or border of the SVG
diagram. This box is defined by its top-left corner x and y coordinates and its width and height, all in pixels. The stroke of the rectangle indicates the
color of the rectangle outline, which in this case is black (red=0, blue=0,
green=0), whereas stroke-width indicates its line width, again in pixels. Because this is an outline of
the diagram, set to none, making the rectangle transparent.

<rect x=”0” y=”0” width=”485” height=”290”
stroke=”rgb(0,0,0)” ➥ stroke-width=”1”
fill=”none”/>
The second child rect element listed below defines a similar transparent rectangle with a
black border that’s 3 pixels in width, only this time the rectangle is serving
as the bound-ing box of the plot within
the SVG view area, rather than the border for the SVG view area, as before.
<rect x=”68.5” y=”11.7” width=”384” height=”224”
stroke=”rgb(0,0,0)” ➥ stroke-width=”3”
fill=”none”/>
The plot has a gray grid of lines as a background. The following line child element defines one of
those lines. The other lines of the matrix are defined similarly. Note that the
line is defined by its start coordinates, x1 and y1,
together with its end coordinates, x2 and y2. The fill, stroke, and stroke-width attributes define the style of the line in the same way as for the rectangles defined previously. The stroke-opacity attribute defines the opacity of
the line, which is a number between 0.0 for invisible and 1.0 for
opaque (the default). Because we want the lines to be faded in the background
of the plot in this case, we set the stroke-opacity to 0.25.
<line x1=”67” y1=”58.8” x2=”451” y2=”58.8”
fill=”none” stroke=”rgb(0,0,0)” ➥ stroke-width=”1”
stroke-opacity=”0.25”/>
The text labels for the axes’ titles and values are specified with the text child elements, the first of
which is shown next. Others are defined similarly. Each text element has a set of attributes
that determines the positioning and style of the label, whereas its text child element specifies the
actual text for the label. Note that the text positioning is spec-ified using
the bottom-left x and y coordinates of the label. The transform element is optionally specified
to change the appearance of the text in some way. In this case, the transform element serves to rotate the text
label 90 degrees counterclockwise so that it reads upwards for the vertical
axis of the plot and then translate the rotated text to move it into position
near the vertical axis of the plot.
<text
x=”10px” y=”155px” transform=”rotate(-90) translate(-220,-115)”
➥ fill=”rgb(0,0,0)”
font-family=”Arial”
font-size=”24”>Principal
Dollars</text>
The polyline child element shown below specifies a multisegment line in the vector
dia-gram. The endpoints of the line segments making up this polyline child element are specified
using the points attribute of this element. These points are x, y coordinates in
sequence, moving along the polyline segment from start to end. Note that this polyline child element could also be
represented as a set of line elements; however, this would be much more verbose and slower to render
for complex datasets.
<polyline fill=”none” stroke=”rgb(255,0,0)”
stroke-width=”2” ➥ points=”68.5,11.7 196.5,85.87
324.5,160.53 452.5,235.7”/>
The data points of the plot that appear along the polyline are
represented using circle child elements. Each circle is specified by its center coordinates, cx and cy, together with its radius, r. The fill, stroke, and stroke-width attributes define the style of the circle in the same manner as for the
rectangles discussed previously. Note that the circles in this case are opaque
and red in color. The first data point circle child element is shown here (others are defined similarly) :
<circle cx=”68.5” cy=”11.7” r=”4”
fill=”rgb(255,0,0)” stroke=”rgb(0,0,0)” ➥ stroke-width=”1”/>
Related Topics