Chapter: An Introduction to Parallel Programming : Parallel Hardware and Parallel Software
Performance of Parallel Programming
PERFORMANCE
Of course our main purpose in
writing parallel programs is usually increased performance. So what can we
expect? And how can we evaluate our programs?
1. Speedup and efficiency
Usually the best we can hope to do is to equally divide the work among the cores, while at the same time introducing no additional work for the cores. If we succeed in doing this, and we run our program with p cores, one thread or process on each core, then our parallel program will run p times faster than the serial program. If we call the serial run-time Tserial and our parallel run-time Tparallel, then the best we can hope for is Tparallel = Tserial/p. When this happens, we say that our parallel program has linear speedup.
In practice, we’re unlikely to get linear
speedup because the use of multiple processes/threads almost invariably
introduces some overhead. For example, shared-memory programs will almost
always have critical sections, which will require that we use some mutual
exclusion mechanism such as a mutex. The calls to the mutex functions are
overhead that’s not present in the serial program, and the use of the mutex
forces the parallel program to serialize execution of the critical section.
Distributed-memory programs will almost always need to transmit data across the
network, which is usually much slower than local memory access. Serial
programs, on the other hand, won’t have these overheads. Thus, it will be very
unusual for us to find that our parallel programs get linear speedup.
Furthermore, it’s likely that the overheads will increase as we increase the
number of processes or threads, that is, more threads will probably mean more
threads need to access a critical section. More processes will probably mean
more data needs to be transmitted across the network.
So if we define the speedup of a parallel program to be

then linear speedup has S = p, which is unusual. Furthermore, as p increases, we expect S to become a smaller and smaller fraction of the ideal, linear
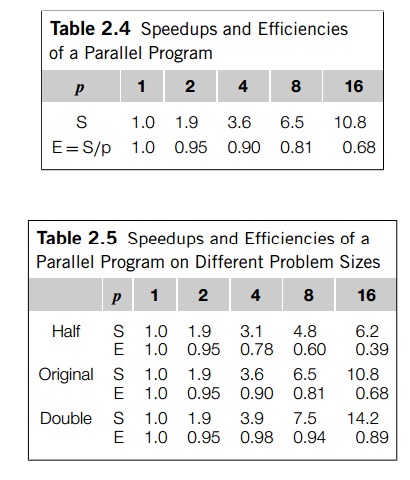
speedup p. Another way of saying this is that S=p will probably get smaller and smaller as p increases. Table 2.4 shows an example of the
changes in S and S/p as p increases.
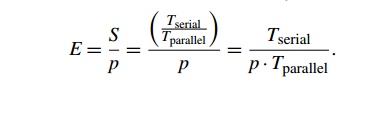
This value, S/p, is sometimes called the efficiency of the parallel program. If we substitute the formula for S, we see that the efficiency is


It’s clear that Tparallel, S, and E depend on p, the number of processes or threads. We also need to keep in mind
that Tparallel, S, E, and Tserial all
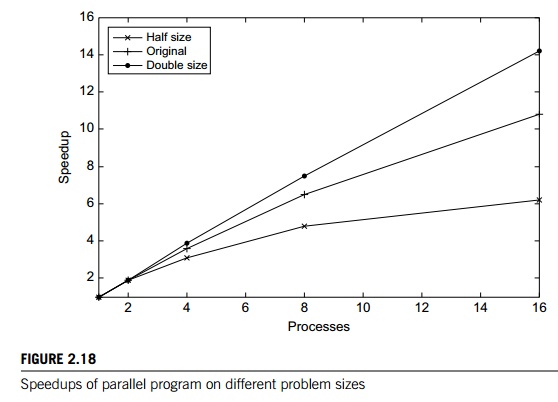
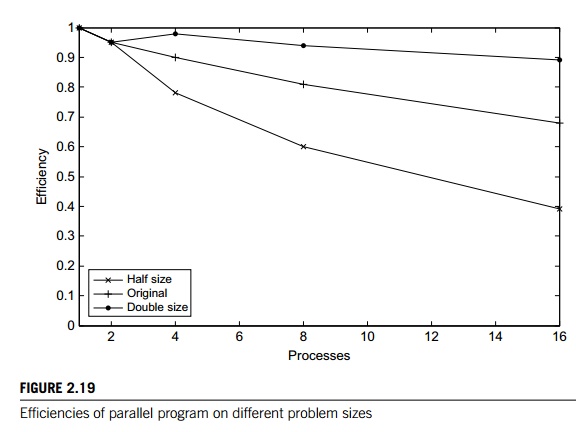
depend on the problem size. For example, if we halve and double the problem
size of the program whose speedups are shown in Table 2.4, we get the speedups
and efficiencies shown in Table 2.5. The speedups are plotted in Figure 2.18,
and the efficiencies are plotted in Figure 2.19.
We see that in this example, when we increase
the problem size, the speedups and the efficiencies increase, while they
decrease when we decrease the problem size. This behavior is quite common. Many
parallel programs are developed by dividing the work of the serial program
among the processes/threads and adding in the nec-essary “parallel overhead”
such as mutual exclusion or communication. Therefore, if Toverhead denotes this parallel overhead, it’s often the case that

Furthermore, as the problem size is increased, Toverhead often grows more slowly than Tserial. When
this is the case the speedup and the efficiency will increase. See Exercise
2.16. This is what your intuition should tell you: there’s more work for the
processes/threads to do, so the relative amount of time spent coordinating the
work of the processes/threads should be less.
A final issue to consider is what values of Tserial should be used when report-ing speedups and efficiencies. Some
authors say that Tserial should
be the run-time of the fastest program on the fastest processor available. In
practice, most authors use a serial program on which the parallel program was
based and run it on a single processor of the parallel system. So if we were
studying the performance of a par-allel shell sort program, authors in the
first group might use a serial radix sort or quicksort on a single core of the
fastest system available, while authors in the second group would use a serial
shell sort on a single processor of the parallel system. We’ll generally use
the second approach.


2. Amdahl’s law
Back in the 1960s, Gene Amdahl made an observation
[2] that’s become known as Amdahl’s law. It says, roughly, that unless virtually all of
a serial program is paral-lelized, the possible speedup is going to be very
limited—regardless of the number of cores available. Suppose, for example, that
we’re able to parallelize 90% of a serial program. Further suppose that the
parallelization is “perfect,” that is, regardless of the number of cores p we use, the speedup of this part of the
program will be p. If the serial run-time is Tserial= 20
seconds, then the run-time of the parallelized part will be 0.9 xTserial/p = 18=p and the run-time of the
“unparallelized” part will be 0.1 x Tserial = 2. The overall parallel run-time will be

Now as p gets larger and larger, 0.9 Tserial=p = 18=p gets closer and closer to 0, so the total parallel run-time can’t
be smaller than 0.1 Tserial = 2. That is, the denom-inator in S can’t be smaller than 0.1 Tserial = 2. The fraction S must therefore be smaller than

That is, S <= 10. This is saying that even though we’ve done a perfect job in
paral-lelizing 90% of the program, and even if we have, say, 1000 cores, we’ll
never get a speedup better than 10.
More generally, if a fraction r of our serial program remains unparallelized,
then Amdahl’s law says we can’t get a speedup better than 1=r. In our example, r = 1- 0.9 = 1/10, so we couldn’t get a speedup better than
10. Therefore, if a fraction r of our serial program is “inherently serial,” that is, cannot
possibly be parallelized, then we can’t possibly get a speedup better than 1=r. Thus, even if r is quite small— say 1/100—and we have a system with thousands of
cores, we can’t possibly get a speedup better than 100.
This is pretty daunting. Should we give up and
go home? Well, no. There are several reasons not to be too worried by Amdahl’s
law. First, it doesn’t take into con-sideration the problem size. For many
problems, as we increase the problem size, the “inherently serial” fraction of
the program decreases in size; a more mathemat-ical version of this statement
is known as Gustafson’s law [25]. Second, there are thousands of programs
used by scientists and engineers that routinely obtain huge speedups on large
distributed-memory systems. Finally, is a small speedup so awful? In many
cases, obtaining a speedup of 5 or 10 is more than adequate, especially if the
effort involved in developing the parallel program wasn’t very large.
3. Scalability
The word “scalable” has a wide variety of
informal uses. Indeed, we’ve used it several times already. Roughly speaking, a
technology is scalable if it can handle ever-increasing problem sizes. However,
in discussions of parallel program perfor-mance, scalability has a somewhat more
formal definition. Suppose we run a parallel program with a fixed number of
processes/threads and a fixed input size, and we obtain an efficiency E. Suppose we now increase the number of
processes/threads that are used by the program. If we can find a corresponding
rate of increase in the problem size so that the program always has efficiency E, then the program is scalable.
As an example, suppose that Tserial = n, where the units of Tserial are in
microsec-onds, and n is also the problem size. Also suppose that Tparallel = n/p + 1. Then

To see if the program is scalable, we increase
the number of processes/threads by a factor of k, and we want to find the factor x that we need to increase the problem size by so that E is unchanged. The number of processes/threads
will be kp and the problem size will be xn, and we want to solve the following equation
for x:

Well, if x = k, there will be a common factor of k in the denominator xn + kp = kn +
kp = k(n + p), and we can reduce the fraction to get

In other words, if we increase the problem size
at the same rate that we increase the number of processes/threads, then the
efficiency will be unchanged, and our program is scalable.
There are a couple of cases that have special
names. If when we increase the number of processes/threads, we can keep the
efficiency fixed without increasing the problem size, the program is said to be strongly scalable. If we can keep the efficiency fixed by
increasing the problem size at the same rate as we increase the number of
processes/threads, then the program is said to be weakly scalable. The program in our example would be weakly
scalable.
4. Taking timings
You may have been wondering how we find Tserial and Tparallel. There
are a lot of different approaches, and with parallel
programs the details may depend on the API. However, there are a few general
observations we can make that may make things a little easier.
The first thing to note is that there are at
least two different reasons for taking tim-ings. During program development we
may take timings in order to determine if the program is behaving as we intend.
For example, in a distributed-memory program we might be interested in finding
out how much time the processes are spending waiting for messages, because if
this value is large, there is almost certainly something wrong either with our
design or our implementation. On the other hand, once we’ve com-pleted
development of the program, we’re often interested in determining how good its
performance is. Perhaps surprisingly, the way we take these two timings is
usually different. For the first timing, we usually need very detailed
information: How much time did the program spend in this part of the program?
How much time did it spend in that part? For the second, we usually report a
single value. Right now we’ll talk about the second type of timing. See
Exercise 2.22 for a brief discussion of some issues in taking the first type of
timing.
Second, we’re usually not interested in the time that elapses between
the pro-gram’s start and the program’s finish. We’re usually interested only in
some part of the program. For example, if we write a program that implements
bubble sort, we’re probably only interested in the time it takes to sort the
keys, not the time it takes to read them in and print them out. We probably
can’t use something like the Unix shell command time, which reports the time taken to run a program
from start to finish.
Third, we’re usually not interested in “CPU time.” This is the time
reported by the standard C function clock. It’s the total time the program spends in
code executed as part of the program. It would include the time for code we’ve
written; it would include the time we spend in library functions such as pow or sin; and it would include the time the operating
system spends in functions we call, such as printf and scanf. It would not include time the program was
idle, and this could be a prob-lem. For example, in a distributed-memory
program, a process that calls a receive function may have to wait for the
sending process to execute the matching send, and the operating system might
put the receiving process to sleep while it waits. This idle time wouldn’t be
counted as CPU time, since no function that’s been called by the process is
active. However, it should count in our evaluation of the overall run-time,
since it may be a real cost in our program. If each time the program is run,
the process has to wait, ignoring the time it spends waiting would give a
misleading picture of the actual run-time of the program.
Thus, when you see an article reporting the
run-time of a parallel program, the reported time is usually “wall clock” time.
That is, the authors of the article report the time that has elapsed between
the start and finish of execution of the code that the user is interested in.
If the user could see the execution of the program, she would hit the start
button on her stopwatch when it begins execution and hit the stop button when
it stops execution. Of course, she can’t see her code executing, but she can
modify the source code so that it looks something like this:
double start, finish;
. . .
start = Get_current_time();
/* Code
that we want to time */
. . .
finish = Get_current time();
printf("The elapsed time = %e
seconds\n", finish-start);
The function Get_current_time() is a
hypothetical function that’s supposed to at’s supposed to return the number of
seconds that have elapsed since some fixed time in the past. It’s just a
placeholder. The actual function that is used will depend on the API. For
example, MPI has a function MPI Wtime that could be used here, and the OpenMP API
for shared-memory programming has a function omp
get wtime. Both functions return wall
clock time instead of CPU time.
There may be an issue with the resolution of the timer function. The resolution is the
unit of measurement on the timer. It’s the duration of the shortest event that
can have a nonzero time. Some timer functions have resolutions in milliseconds
(10 3 seconds), and when instructions can take times that are less
than a nanosecond (10 9 seconds), a program may have to execute
millions of instructions before the timer reports a nonzero time. Many APIs
provide a function that reports the resolution of the timer. Other APIs specify
that a timer must have a given resolution. In either case we, as the
programmers, need to check these values.
When we’re timing parallel programs, we need to
be a little more careful about how the timings are taken. In our example, the
code that we want to time is probably being executed by multiple processes or
threads and our original timing will result in the output of p elapsed times.
private double start, finish;
. . .
start = Get_current_time();
/* Code
that we want to time */
. . .
finish = Get_current_time();
printf("The elapsed time = %e
seconds\n", finish-start);
However, what we’re usually interested in is a
single time: the time that has elapsed from when the first process/thread began
execution of the code to the time the last process/thread finished execution of
the code. We often can’t obtain this exactly, since there may not be any
correspondence between the clock on one node and the clock on another node. We
usually settle for a compromise that looks something like this:
shared double global_elapsed;
private double my_start, my_finish, my_elapsed;
/* Synchronize
all processes/threads */
Barrier();
my_start = Get_current_time();
/* Code
that we want to time */
. . .
my_finish = Get_current_time();
my_elapsed = my_finish - my_start;
/* Find the max across all processes/threads */
global_elapsed = Global max(my_elapsed);
if (my rank == 0)
printf("The elapsed time = %e
seconds\n", global elapsed);
shared double global elapsed;
Here, we first execute a barrier function that approximately synchronizes all
of the processes/threads. We would like for all the processes/threads to return
from the call simultaneously, but such a function usually can only guarantee
that all the process-es/threads have started the call when the first
process/thread returns. We then execute the code as before and each
process/thread finds the time it took. Then all the process-es/threads call a
global maximum function, which returns the largest of the elapsed times, and
process/thread 0 prints it out.
We also need to be aware of the variability in timings. When we run a program several
times, it’s extremely likely that the elapsed time will be different for each
run. This will be true even if each time we run the program we use the same
input and the same systems. It might seem that the best way to deal with this
would be to report either a mean or a median run-time. However, it’s unlikely
that some outside event could actually make our program run faster than its
best possible run-time. So instead of reporting the mean or median time, we
usually report the minimum time.
Running more than one thread per core can cause
dramatic increases in the variability of timings. More importantly, if we run
more than one thread per core, the system will have to take extra time to
schedule and deschedule cores, and this will add to the overall run-time.
Therefore, we rarely run more than one thread per core.
Finally, as a practical matter, since our
programs won’t be designed for high-performance I/O, we’ll usually not include
I/O in our reported run-times.
Related Topics