Chapter: Distributed and Cloud Computing: From Parallel Processing to the Internet of Things : Distributed System Models and Enabling Technologies
Performance, Security, and Energy Efficiency
PERFORMANCE, SECURITY, AND ENERGY EFFICIENCY
In this section, we will
discuss the fundamental design principles along with rules of thumb for
building massively distributed computing systems. Coverage includes
scalability, availability, programming models, and security issues in
clusters, grids, P2P networks, and Internet clouds.
1. Performance Metrics and Scalability
Analysis
Performance metrics are
needed to measure various distributed systems. In this section, we will
dis-cuss various dimensions of scalability and performance laws. Then we will
examine system scalabil-ity against OS images and the limiting factors
encountered.
1.1
Performance Metrics
We discussed CPU
speed in MIPS and network
bandwidth in Mbps in Section 1.3.1 to
estimate pro-cessor and network performance. In a distributed system,
performance is attributed to a large number of factors. System throughput is often measured in MIPS, Tflops
(tera floating-point operations per second), or TPS (transactions per
second). Other measures include job response time and network
latency. An interconnection network that has low
latency and high bandwidth is preferred. System overhead is often attributed to OS boot time,
compile time, I/O data rate, and the runtime support sys-tem used. Other
performance-related metrics include the QoS for Internet and web services; system availability and dependability; and
security resilience for
system defense against network attacks.
1.2
Dimensions of Scalability
Users want to have a distributed system that
can achieve scalable performance. Any resource upgrade in a system should be
backward compatible with existing hardware and software resources. Overdesign
may not be cost-effective. System scaling can increase or decrease resources
depending on many practi-cal factors. The following dimensions of scalability
are characterized in parallel and distributed systems:
• Size scalability This refers to achieving
higher performance or more functionality by increasing the machine size. The word “size” refers to adding processors, cache, memory,
storage, or I/O channels. The most obvious way to determine size scalability is
to simply count the number of processors installed. Not all parallel computer
or distributed architectures are equally size-scalable. For example, the IBM S2
was scaled up to 512 processors in 1997. But in 2008, the IBM BlueGene/L system
scaled up to 65,000 processors.
• Software scalability This
refers to upgrades in the OS or compilers, adding mathematical and engineering
libraries, porting new application software, and installing more user-friendly
programming environments. Some software upgrades may not work with large system
configurations. Testing and fine-tuning of new software on larger systems is a
nontrivial job.
• Application scalability This refers to matching
problem size scalability with machine size scalability. Problem size affects the size of
the data set or the workload increase. Instead of increasing machine size,
users can enlarge the problem size to enhance system efficiency or
cost-effectiveness.
• Technology scalability This refers to a system
that can adapt to changes in building tech-nologies, such as the component and
networking technologies discussed in Section 3.1. When scaling a system design
with new technology one must consider three aspects: time, space, and heterogeneity. (1) Time refers to generation scalability.
When changing to new-generation processors, one must consider the impact to the
motherboard, power supply, packaging and cooling, and so forth. Based on past
experience, most systems upgrade their commodity processors every three to five
years. (2) Space is related to packaging and energy concerns. Technology
scalability demands harmony and portability among suppliers. (3) Heterogeneity
refers to the use of hardware components or software packages from different
vendors. Heterogeneity may limit the scalability.
1.3
Scalability versus OS Image Count
In Figure 1.23, scalable performance is estimated against the multiplicity of OS images in distributed systems
deployed up to 2010. Scalable performance implies that the system can achieve
higher speed by adding more processors or servers, enlarging the physical node’s memory size, extending the disk capacity, or
adding more I/O channels. The OS image is counted by the number of inde-pendent
OS images observed in a cluster, grid, P2P network, or the cloud. SMP and NUMA
are included in the comparison. An SMP (symmetric multiprocessor) server has a single system
image, which could be a single node in a large cluster. By 2010 standards, the
largest shared-memory SMP node was limited to a few hundred processors. The
scalability of SMP systems is constrained primarily by packaging and the system
interconnect used.
NUMA (nonuniform memory
access) machines are often made out of SMP nodes with distributed, shared
memory. A NUMA machine can run with multiple operating systems, and can scale
to a few thousand processors communicating with the MPI library. For example, a
NUMA machine may have 2,048 processors running 32 SMP operating systems,
resulting in 32 OS images in the 2,048-processor NUMA system. The cluster nodes
can be either SMP servers or high-end machines that are loosely coupled
together. Therefore, clusters have much higher scalability than NUMA machines.
The number of OS images in a cluster is based on the cluster nodes concurrently
in use. The cloud could be a virtualized cluster. As of 2010, the largest cloud
was able to scale up to a few thousand VMs.
Keeping in mind that many
cluster nodes are SMP or multicore servers, the total number of pro-cessors or
cores in a cluster system is one or two orders of magnitude greater than the
number of OS images running in the cluster. The grid node could be a server
cluster, or a mainframe, or a supercomputer, or an MPP. Therefore, the number
of OS images in a large grid structure could be hundreds or thousands fewer
than the total number of processors in the grid. A P2P network can easily scale
to millions of independent peer nodes, essentially desktop machines. P2P
performance
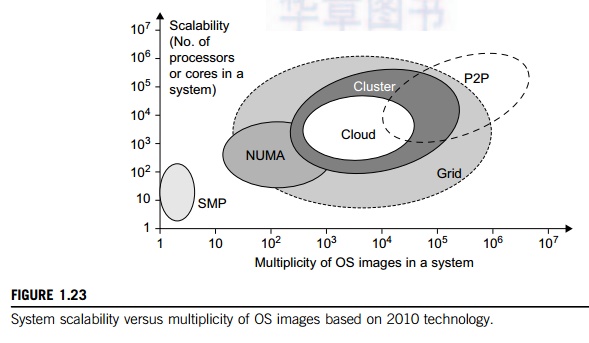
depends on the QoS in a
public network. Low-speed P2P networks, Internet clouds, and computer clusters
should be evaluated at the same networking level.
1.4
Amdahl’s Law
Consider the execution of a
given program on a uniprocessor workstation with a total execution time of T minutes. Now, let’s say the program has been parallelized or
partitioned for parallel execution on a cluster of many processing nodes.
Assume that a fraction α of the code must be executed
sequentially, called the sequential
bottleneck. Therefore, (1 − α) of the code can be compiled for parallel
execution by n processors. The total
execution time of the program is calculated by α T + (1 − α)T/n, where the first term is the sequential
execution time on a single processor and the second term is the parallel execution time on n processing nodes.
All
system or communication overhead is ignored here. The I/O time or exception
handling time is also not included in the following speedup analysis. Amdahl’s Law states that the speedup factor of using the n-processor system over the use of a single
processor is expressed by:

The
maximum speedup of n is achieved only if the sequential bottleneck α is reduced to zero or the code is fully
parallelizable with α = 0. As the cluster becomes
sufficiently large, that is, n → ∞, S approaches 1/α, an upper bound on the speedup S. Surprisingly, this upper bound is
independent of the cluster size n. The sequential bottleneck is the portion of
the code that cannot be parallelized. For example, the maximum speedup
achieved is 4, if α = 0.25 or 1 − α = 0.75, even if one uses hundreds of
processors. Amdahl’s law teaches us that we
should make the sequential bottle-neck as small as possible. Increasing the
cluster size alone may not result in a good speedup in this case.
1.5
Problem with Fixed Workload
In Amdahl’s law, we have assumed the same amount of
workload for both sequential and parallel execution of the program with a fixed
problem size or data set. This was called fixed-workload speedup by Hwang and Xu [14]. To execute a fixed
workload on n processors, parallel
processing may lead to a system efficiency defined as follows:

Very
often the system efficiency is rather low, especially when the cluster size is
very large. To execute the aforementioned program on a cluster with n = 256 nodes, extremely low efficiency E = 1/[0.25 × 256 + 0.75] = 1.5% is observed. This is because only
a few processors (say, 4) are kept busy, while the majority
of the nodes are left idling.
1.6
Gustafson’s Law
To achieve higher efficiency
when using a large cluster, we must consider scaling the problem size to match
the cluster capability. This leads to the following speedup law proposed by
John Gustafson (1988), referred as scaled-workload speedup in [14]. Let W be the workload in a given program. When using
an n-processor system, the user
scales the workload to W′ = αW + (1 − α)nW. Note that only the parallelizable portion of
the workload is scaled n times in the second term.
This scaled workload W′ is essentially the
sequential execution time on a single processor. The parallel execution time of
a scaled workload W′ on n processors is defined by a scaled-workload speedup as follows:

This speedup is known as
Gustafson’s law. By fixing the parallel
execution time at level W, the following efficiency
expression is obtained:

For the
preceding program with a scaled workload, we can improve the efficiency of
using a 256-node cluster to E′ = 0.25/256 + 0.75 = 0.751.
One should apply Amdahl’s law and Gustafson’s law under different workload conditions. For
a fixed workload, users should apply Amdahl’s law. To solve scaled problems, users should
apply Gustafson’s law.
2. Fault Tolerance and System
Availability
In addition to performance,
system availability and application flexibility are two other important design
goals in a distributed computing system.
2.1
System Availability
HA (high availability) is
desired in all clusters, grids, P2P networks, and cloud systems. A system is
highly available if it has a long mean time to failure (MTTF) and a short mean time to repair (MTTR). System availability is formally defined as
follows:

System
availability is attributed to many factors. All hardware, software, and network
components may fail. Any failure that will pull down the operation of the
entire system is called a single point of failure. The rule of thumb is to design a dependable
computing system with no single point of failure. Adding
hardware redundancy, increasing component reliability, and designing for
testability will help to enhance system availability and dependability. In
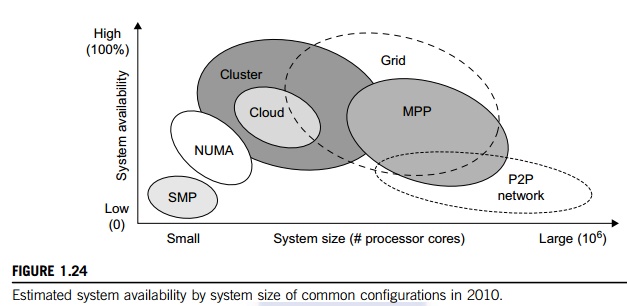
Figure 1.24, the effects on system availability are estimated by scaling the
system size in terms of the number of processor cores in the system.
In general, as a distributed
system increases in size, availability decreases due to a higher chance of
failure and a difficulty in isolating the failures. Both SMP and MPP are very
vulnerable with centralized resources under one OS. NUMA machines have improved
in availability due to the use of multiple OSes. Most clusters are designed to
have HA with failover capability. Meanwhile, pri-vate clouds are created out of
virtualized data centers; hence, a cloud has an estimated availability similar
to that of the hosting cluster. A grid is visualized as a hierarchical cluster
of clusters. Grids have higher availability due to the isolation of faults.
Therefore, clusters, clouds, and grids have decreasing availability as the
system increases in size. A P2P file-sharing network has the highest
aggregation of client machines. However, it operates independently with low
availability, and even many peer nodes depart or fail simultaneously.
3. Network Threats and Data Integrity
Clusters, grids, P2P
networks, and clouds demand security and copyright protection if they are to be
accepted in today’s digital society. This
section introduces system vulnerability, network threats, defense countermeasures,
and copyright protection in distributed or cloud computing systems.
3.1
Threats to Systems and Networks
Network viruses have
threatened many users in widespread attacks. These incidents have created a
worm epidemic by pulling down many routers and servers, and are responsible for
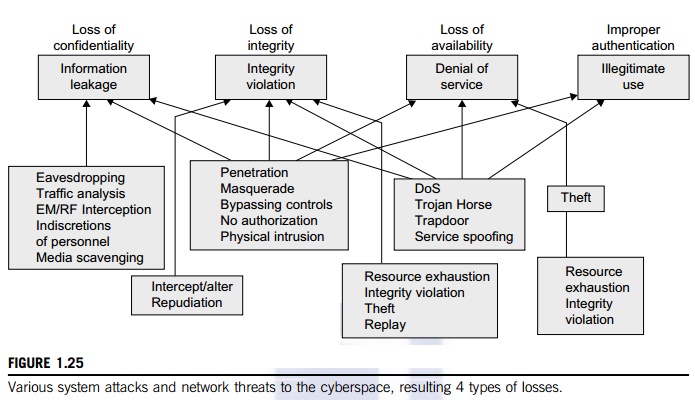
the loss of bil-lions of dollars in business, government, and services. Figure
1.25 summarizes various attack types and their potential damage to users. As
the figure shows, information leaks lead to a loss of confidentiality. Loss of
data integrity may be caused by user alteration, Trojan horses, and service
spoofing attacks. A denial
of service (DoS) results in a loss of system operation and Internet connections.
Lack of
authentication or authorization leads to attackers’ illegitimate use of computing resources. Open
resources such as data centers, P2P networks, and grid and cloud
infrastructures could become the next targets. Users need to protect clusters,
grids, clouds, and P2P systems. Otherwise, users should not use or trust them
for outsourced work. Malicious intrusions to these systems may destroy valuable
hosts, as well as network and storage resources. Internet anomalies found in
routers, gateways, and distributed hosts may hinder the acceptance of these
public-resource computing services.
3.2
Security Responsibilities
Three security requirements
are often considered: confidentiality, integrity, and availability for most Internet service providers and cloud
users. In the order of SaaS, PaaS, and IaaS, the providers gra-dually release
the responsibility of security control to the cloud users. In summary, the SaaS
model relies on the cloud provider to perform all security functions. At the
other extreme, the IaaS model wants the users to assume almost all security
functions, but to leave availability in the hands of the providers. The PaaS
model relies on the provider to maintain data integrity and availability, but
bur-dens the user with confidentiality and privacy control.
3.3
Copyright Protection
Collusive piracy is the main
source of intellectual property violations within the boundary of a P2P
network. Paid clients (colluders) may illegally share copyrighted content files
with unpaid clients (pirates). Online piracy has hindered the use of open P2P
networks for commercial content delivery. One can develop a proactive content
poisoning scheme to stop colluders and pirates from alleged copy-right
infringements in P2P file sharing. Pirates are detected in a timely manner with
identity-based signatures and timestamped tokens. This scheme stops collusive
piracy from occurring without hurting legitimate P2P clients. Chapters 4 and 7
cover grid and cloud security, P2P reputation systems, and copyright
protection.
3.4
System Defense Technologies
Three generations of network
defense technologies have appeared in the past. In the first generation, tools
were designed to prevent or avoid intrusions. These tools usually manifested
themselves as access control policies or tokens, cryptographic systems, and so
forth. However, an intruder could always penetrate a secure system because
there is always a weak link in the security provisioning process. The second
generation detected intrusions in a timely manner to exercise remedial actions.
These techniques included firewalls, intrusion detection systems (IDSes), PKI
services, reputation systems, and so on. The third generation provides more
intelligent responses to intrusions.
3.5
Data Protection Infrastructure
Security infrastructure is
required to safeguard web and cloud services. At the user level, one needs to
perform trust negotiation and reputation aggregation over all users. At the
application end, we need to establish security precautions in worm containment
and intrusion detection against virus, worm, and distributed DoS (DDoS)
attacks. We also need to deploy mechanisms to prevent online piracy and
copyright violations of digital content. In Chapter 4, we will study reputation
systems for protecting cloud systems and data centers. Security
responsibilities are divided between cloud providers and users differently for
the three cloud service models. The providers are totally responsible for
platform availability. The IaaS users are more responsible for the
confidentiality issue. The IaaS providers are more responsible for data
integrity. In PaaS and SaaS services, providers and users are equally
responsible for preserving data integrity and confidentiality.
4. Energy Efficiency in Distributed
Computing
Primary performance goals in
conventional parallel and distributed computing systems are high performance
and high throughput, considering some form of performance reliability (e.g.,
fault tol-erance and security). However, these systems recently encountered new
challenging issues including energy efficiency, and workload and resource
outsourcing. These emerging issues are crucial not only on their own, but also
for the sustainability of large-scale computing systems in general. This
section reviews energy consumption issues in servers and HPC systems, an area
known as distributed
power management (DPM).
Protection
of data centers demands integrated solutions. Energy consumption in parallel
and dis-tributed computing systems raises various monetary, environmental, and
system performance issues. For example, Earth Simulator and Petaflop are two
systems with 12 and 100 megawatts of peak power, respectively. With an
approximate price of $100 per megawatt, their energy costs during peak
operation times are $1,200 and $10,000 per hour; this is beyond the acceptable
budget of many (potential) system operators. In addition to power cost, cooling
is another issue that must be addressed due to negative effects of high
temperature on electronic components. The rising tempera-ture of a circuit not
only derails the circuit from its normal range, but also decreases the lifetime
of its components.
4.1
Energy Consumption of Unused Servers
To run a server farm (data
center) a company has to spend a huge amount of money for hardware, software,
operational support, and energy every year. Therefore, companies should
thoroughly identify whether their installed server farm (more specifically, the
volume of provisioned resources) is at an appropriate level, particularly in
terms of utilization. It was estimated in the past that, on average, one-sixth
(15 percent) of the full-time servers in a company are left powered on without
being actively used (i.e., they are idling) on a daily basis. This indicates
that with 44 million servers in the world, around 4.7 million servers are not
doing any useful work.
The potential savings in
turning off these servers are large—$3.8 billion globally in energy costs alone,
and $24.7 billion in the total cost of running nonproductive servers, according
to a study by 1E Company in partnership with the Alliance to Save Energy (ASE).
This amount of wasted energy is equal to 11.8 million tons of carbon dioxide
per year, which is equivalent to the CO pollution of 2.1 million cars. In the
United States, this equals 3.17 million tons of carbon dioxide, or 580,678
cars. Therefore, the first step in IT departments is to analyze their servers
to find unused and/or underutilized servers.
4.2
Reducing Energy in Active Servers
In addition to identifying
unused/underutilized servers for energy savings, it is also necessary to apply
appropriate techniques to decrease energy consumption in active distributed
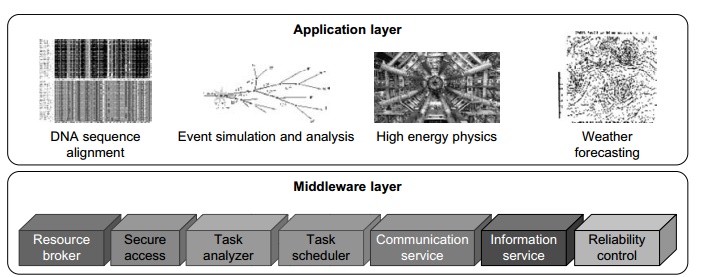
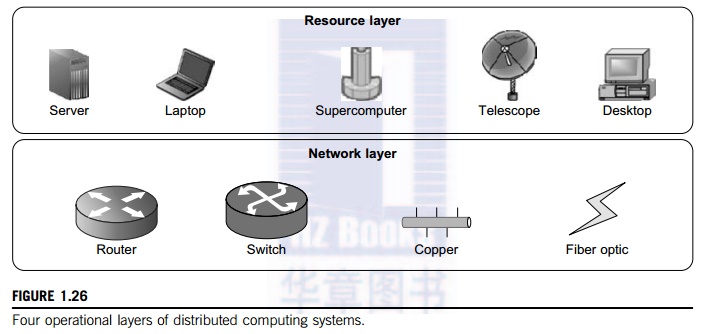
systems with neg-ligible influence on their performance. Power management
issues in distributed computing platforms can be categorized into four layers
(see Figure 1.26): the application layer, middleware layer, resource layer, and
network layer.
4.3
Application Layer
Until now, most user
applications in science, business, engineering, and financial areas tend to increase
a system’s speed or quality. By
introducing energy-aware applications, the challenge is to design sophisticated
multilevel and multi-domain energy management applications without hurting
performance. The first step toward this end is to explore a relationship
between performance and energy consumption. Indeed, an application’s energy consumption depends strongly on the
number of instructions needed to execute the application and the number of
transactions with the storage unit (or memory). These two factors (compute and
storage) are correlated and they affect comple-tion time.
4.4
Middleware Layer
The middleware layer acts as
a bridge between the application layer and the resource layer. This layer
provides resource broker, communication service, task analyzer, task scheduler,
security access, reliability control, and information service capabilities. It
is also responsible for applying energy-efficient techniques, particularly in
task scheduling. Until recently, scheduling was aimed at minimizing makespan, that is, the execution time of a set of
tasks. Distributed computing systems necessitate a new cost function covering
both makespan and energy consumption.
4.5
Resource Layer
The resource layer consists
of a wide range of resources including computing nodes and storage units. This
layer generally interacts with hardware devices and the operating system;
therefore, it is responsible for controlling all distributed resources in
distributed computing systems. In the recent past, several mechanisms have been
developed for more efficient power management of hardware and operating
systems. The majority of them are hardware approaches particularly for
processors.
Dynamic power management
(DPM) and dynamic
voltage-frequency scaling (DVFS) are two popular methods incorporated into recent
computer hardware systems [21]. In DPM, hardware devices, such as the CPU, have
the capability to switch from idle mode to one or more lower-power modes. In
DVFS, energy savings are achieved based on the fact that the power consumption
in CMOS circuits has a direct relationship with frequency and the square of the
voltage supply. Execution time and power consumption are controllable by
switching among different frequencies and voltages [31].
4.6
Network Layer
Routing and transferring
packets and enabling network services to the resource layer are the main
responsibility of the network layer in distributed computing systems. The major
challenge to build energy-efficient networks is, again, determining how to measure,
predict, and create a balance between energy consumption and performance. Two
major challenges to designing energy-efficient networks are:
• The models should represent
the networks comprehensively as they should give a full understanding of
interactions among time, space, and energy.
• New, energy-efficient routing
algorithms need to be developed. New, energy-efficient protocols should be
developed against network attacks.
As information resources
drive economic and social development, data centers become increasingly
important in terms of where the information items are stored and processed, and
where ser-vices are provided. Data centers become another core infrastructure,
just like the power grid and transportation systems. Traditional data centers
suffer from high construction and operational costs, complex resource
management, poor usability, low security and reliability, and huge energy
consumption. It is necessary to adopt new technologies in next-generation
data-center designs, a topic we will discuss in more detail in Chapter 4.
4.7
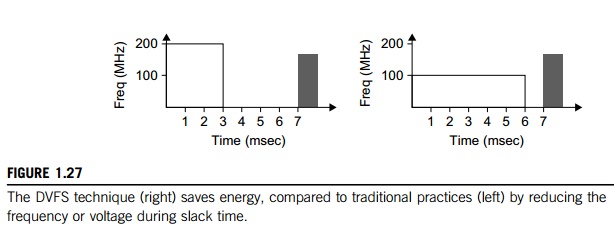
DVFS Method for Energy Efficiency
The DVFS method enables the
exploitation of the slack time (idle time) typically incurred by inter-task
relationship. Specifically, the slack time associated with a task is utilized
to execute the task in a lower voltage frequency. The relationship between
energy and voltage frequency in CMOS circuits is related by:

where v, Ceff, K, and vt are the voltage, circuit switching capacity, a
technology dependent factor, and threshold voltage, respectively, and the
parameter t is the execution time of the
task under clock frequency f. By reducing voltage and
frequency, the device’s energy consumption can also
be reduced.
Example 1.2 Energy Efficiency in Distributed
Power Management
Figure
1.27 illustrates the DVFS method. This technique as shown on the right saves
the energy compared to traditional practices shown on the left. The idea is to
reduce the frequency and/or voltage during work-load slack time. The transition
latencies between lower-power modes are very small. Thus energy is saved by
switching between operational modes. Switching between low-power modes affects
performance. Storage units must interact with the computing nodes to balance
power consumption. According to Ge, Feng, and Cameron [21], the storage devices
are responsible for about 27 percent of the total energy con-sumption in a data
center. This figure increases rapidly due to a 60 percent increase in storage
needs annually, making the situation even worse.
Related Topics