Chapter: Advanced Computer Architecture : Instruction Level Parallelism
Measuring and Reporting Performance
Measuring and Reporting
Performance
The
computer user is interested in reducing response time( the time between the
start and the completion of an event) also referred to as execution time. The
manager of a large data processing center may be interested in increasing
throughput( the total amount of work done in a given time).
Even
execution time can be defined in different ways depending on what we count. The
most straightforward definition of time is called wall-clock time, response
time, or elapsed time, which is the latency to complete a task, including disk
accesses, memory accesses, input/output activities, operating system overhead
Choosing Programs to Evaluate Performance
A
computer user who runs the same programs day in and day out would be the
perfect candidate to evaluate a new computer. To evaluate a new system the user
would simply compare the execution time of her workload—the mixture of programs
and operating system commands that users run on a machine.
There are
five levels of programs used in such circumstances, listed below in decreasing
order of accuracy of prediction.
1. Real applications—
Although the buyer may not know what fraction of time is spent on these
programs, she knows that some users will run them to solve real problems.
Examples are compilers for C, text-processing software like Word, and other
applications like Photoshop. Real applications have input, output, and options
that a user can select when running the program. There is one major downside to
using real applications as benchmarks: Real applications often encounter
portability problems arising from dependences on the operating system or
compiler. Enhancing portability often means modifying the source and sometimes
eliminating some important activity, such as interactive graphics, which tends
to be more system-dependent.
2. Modified
(or scripted) applications—In many cases, real applications are used as the
building block for a benchmark either with modifications to the application or
with a script that acts as stimulus to the application. Applications are
modified for two primary reasons: to enhance portability or to focus on one
particular aspect of system performance. For example, to create a CPU-oriented
benchmark, I/O may be removed or restructured to minimize its impact on
execution time. Scripts are used to reproduce interactive behavior, which might
occur on a desktop system, or to simulate complex multiuser interaction, which
occurs in a server system.
Kernels—Several
attempts have been made to extract small, key pieces from real programs and use
them to evaluate performance. Livermore Loops and Linpack are the best known
examples. Unlike real programs, no user would run kernel programs, for they
exist solely to evaluate performance. Kernels are best used to isolate
performance of individual features of a machine to explain the reasons for
differences in performance of real programs.
4. Toy
benchmarks—Toy benchmarks are typically between 10 and 100 lines of code and
produce a result the user already knows before running the toy program.
Programs like Sieve of Eratosthenes, Puzzle, and Quicksort are popular because
they are small, easy to type, and run on almost any computer. The best use of
such programs is beginning programming assignments
5. Synthetic
benchmarks—Similar in philosophy to kernels, synthetic benchmarks try to match
the average frequency of operations and operands of a large set of programs.
Whetstone and Dhrystone are the most popular synthetic benchmarks.
Benchmark Suites
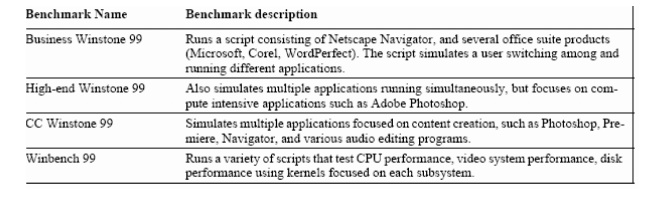
Recently,
it has become popular to put together collections of benchmarks to try to
measure the performance of processors with a variety of applications. One of
the most successful attempts to create standardized benchmark application
suites has been the SPEC (Standard Performance Evaluation Corporation), which
had its roots in the late 1980s efforts to deliver better benchmarks for
workstations. Just as the computer industry has evolved over time, so has the
need for different benchmark suites, and there are now SPEC benchmarks to cover
different application classes, as well as other suites based on the SPEC model.
Which is shown in figure
Desktop Benchmarks
Desktop
benchmarks divide into two broad classes: CPU intensive benchmarks and graphics
intensive benchmarks intensive CPU activity). SPEC originally created a
benchmark set focusing on CPU performance (initially called SPEC89), which has
evolved into its fourth generation: SPEC CPU2000, which follows SPEC95, and
SPEC92.
Although
SPEC CPU2000 is aimed at CPU performance, two different types of graphics
benchmarks were created by SPEC: SPEC viewperf is used for benchmarking systems
supporting the OpenGL graphics library, while SPECapc consists of applications
that make extensive use of graphics. SPECviewperf measures the 3D rendering
performance of systems running under OpenGL using a 3-D model and a series of
OpenGL calls that transform the model. SPECapc consists of runs of three large
applications:
1. Pro/Engineer:
a solid modeling application that does extensive 3-D rendering. The input
script is a model of a photocopying machine consisting of 370,000 triangles.
SolidWorks
99: a 3-D CAD/CAM design tool running a series of five tests varying from I/O
intensive to CPU intensive. The largetest input is a model of an assembly line
consisting of 276,000 triangles.
3.
Unigraphics V15: The benchmark is based on an aircraft model and covers a wide
spectrum of Unigraphics functionality, including assembly, drafting, numeric
control machining, solid modeling, and optimization. The inputs are all part of
an aircraft design.
Server Benchmarks
Just as servers
have multiple functions, so there are multiple types of benchmarks. The
simplest benchmark is perhaps a CPU throughput oriented benchmark. SPEC CPU2000
uses the SPEC CPU benchmarks to construct a simple throughput benchmark where
the processing rate of a multiprocessor can be measured by running multiple
copies (usually as many as there are CPUs) of each SPEC CPU benchmark and
converting the CPU time into a rate. This leads to a measurement called the
SPECRate. Other than SPECRate, most server applications and benchmarks have
significant I/O activity arising from either disk or network traffic, including
benchmarks for file server systems, for web servers, and for database and
transaction processing systems. SPEC offers both a file server benchmark (SPECSFS)
and a web server benchmark (SPECWeb). SPECSFS (see http://www.spec.org/osg/sfs93/)
is a benchmark for measuring NFS (Network File System) performance using
a script of file server requests; it tests the performance of the I/O system
(both disk and network I/O) as well as the CPU. SPECSFS is a throughput
oriented benchmark but with important response time requirements.
Transaction
processing benchmarks measure the ability of a system to handle transactions,
which consist of database accesses and updates. All the TPC benchmarks measure
performance in transactions per second. In addition, they include a
response-time requirement, so that throughput performance is measured only when
the response time limit is met. To model real-world systems, higher transaction
rates are also associated with larger systems, both in terms of users and the
data base that the transactions are applied to. Finally, the system cost for a
benchmark system must also be included, allowing accurate comparisons of
cost-performance.
Embedded Benchmarks
Benchmarks
for embedded computing systems are in a far more nascent state than those for
either desktop or server environments. In fact, many manufacturers quote
Dhrystone performance, a benchmark that was criticized and given up by desktop
systems more than 10 years ago! As mentioned earlier, the enormous variety in
embedded applications, as well as differences in performance requirements (hard
real-time, soft real-time, and overall cost-performance), make the use of a
single set of benchmarks unrealistic.
In
practice, many designers of embedded systems devise benchmarks that reflect
their application, either as kernels or as stand-alone versions of the entire
application. For those embedded applications that can be characterized well by
kernel performance, the best standardized set of benchmarks appears to be a new
benchmark set: the EDN Embedded Microprocessor Benchmark Consortium (or
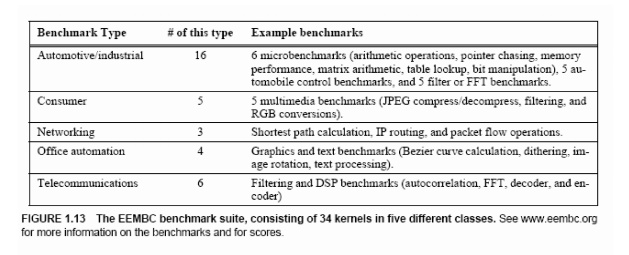
EEMBC–pronounced embassy). The EEMBC benchmarks fall into five classes:
automotive/industrial, consumer, networking, office automation, and
telecommunications Figure shows the five different application classes, which
include 34 benchmarks.
Related Topics