Different types, Formula, Solved Example Problems | Mathematics - Measures of Dispersion | 10th Mathematics : UNIT 8 : Statistics And Probability
Chapter: 10th Mathematics : UNIT 8 : Statistics And Probability
Measures of Dispersion
Measures
of Dispersion
The following data
provide the runs scored by two batsmen in the last 10 matches.
Batsman A: 25, 20, 45,
93, 8, 14, 32, 87, 72, 4
Batsman B: 33, 50, 47,
38, 45, 40, 36, 48, 37, 26

The mean of both datas
are same (40), but they differ significantly.

From the above diagrams,
we see that runs of batsman B are grouped around the mean. But the runs
of batsman A are scattered from 0 to 100, though they both have same
mean.
Thus, some additional
statistical information may be required to determine how the values are spread
in data. For this, we shall discuss Measures of Dispersion.
Dispersion is a measure
which gives an idea about the scatteredness of the values.
Measures of Variation (or) Dispersion of a
data provide an idea of how observations spread out (or) scattered throughout the data.
Different Measures of
Dispersion are
1. Range
2. Mean deviation
3. Quartile deviation
4. Standard deviation
5. Variance
6. Coefficient of
Variation
1. Range
The difference between
the largest value and the smallest value is called Range.
Range R = L – S
Coefficient of range = (L
–S) / (L + S)
where L - Largest
value; S - Smallest value
Example 8.1 Find the range and
coefficient of range of the following data: 25, 67, 48, 53, 18, 39, 44.
Solution Largest value L
= 67; Smallest value S =18
Range R = L −S
= 67 −18 = 49
Coefficient of range = (L
–S) / (L + S)
Coefficient of range = (67
– 18 ) / (67 +18) = 49/85
= 0.576
Example 8.2 Find the range of the
following distribution.

Solution Here Largest value L = 28
Smallest value S
= 18
Range R = L
–S
R = 28 −18
= 10 Years
Example 8.3 The range of a set of
data is 13.67 and the largest value is 70.08. Find the smallest value.
Solution
Range R = 13.67
Largest value L =
70.08
Range R = L
–S
13.67 = 70.08 – S
S = 70.08 −13.67 = 56.41
Therefore, the smallest
value is 56.41.
2. Deviations from the mean
For a given data with n
observations x 1 , x2,¼xn
, the deviations from the mean ![]() are
are

3. Squares of deviations from the mean
The squares of
deviations from the mean ![]() of the observations x1, x2,
. . . . , xn are
of the observations x1, x2,
. . . . , xn are

Note
We note that (x
i − ![]() )2
≥ 0 for all observations xi ,
i = 1,2,3,…,n. If the deviations from the mean
(x i −
)2
≥ 0 for all observations xi ,
i = 1,2,3,…,n. If the deviations from the mean
(x i − ![]() ) are small, then the
squares of the deviations will be very small.
) are small, then the
squares of the deviations will be very small.
4. Variance
The mean of the squares
of the deviations from the mean is called Variance.
It is denoted by σ2
(read as sigma square).
Variance = Mean of
squares of deviations

5. Standard Deviation
The positive square root
of Variance is called Standard deviation. That is, standard deviation is the positive
square root of the mean of the squares of deviations of the given values from
their mean. It is denoted by σ.
Standard deviation gives
a clear idea about
how far the values are spreading or deviating from
the mean.

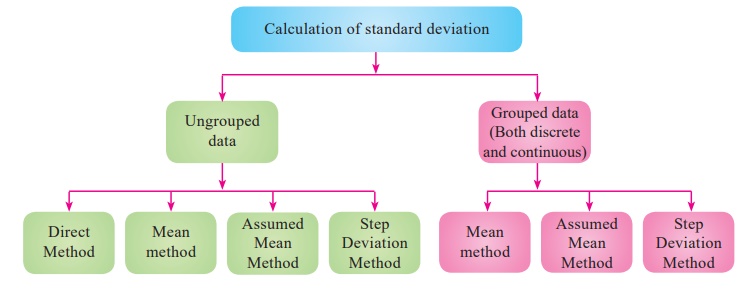
1. Calculation of Standard Deviation for ungrouped data
(i) Direct Method
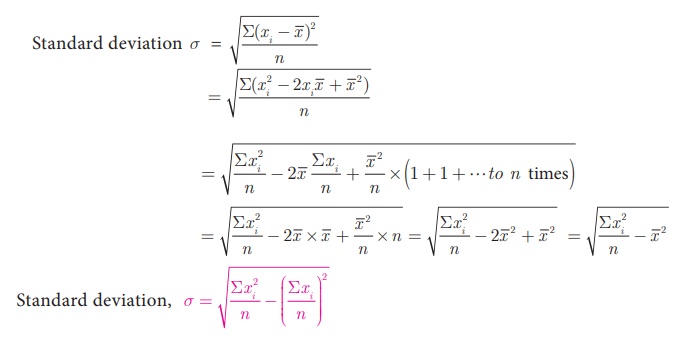
Note
·
While computing standard deviation, arranging data in ascending
order is not mandatory.
·
If the data values are given directly then to find standard
deviation we can use the formula σ = 
·
If the data values are not given directly but the squares of the
deviations from the mean of each observation is given then to find standard
deviation we can use the formula σ = 
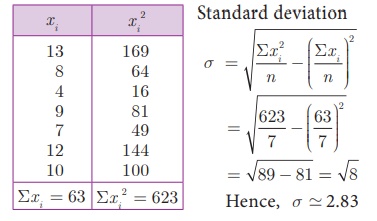
Example 8.4 The number of
televisions sold in each day of a week are 13, 8, 4, 9, 7, 12, 10.
Find its standard
deviation.
Solution
(ii) Mean method
Another convenient way
of finding standard deviation is to use the following formula.
Standard deviation (by
mean method) σ = 
If di = xi – ![]() are the deviations, then
are the deviations, then 
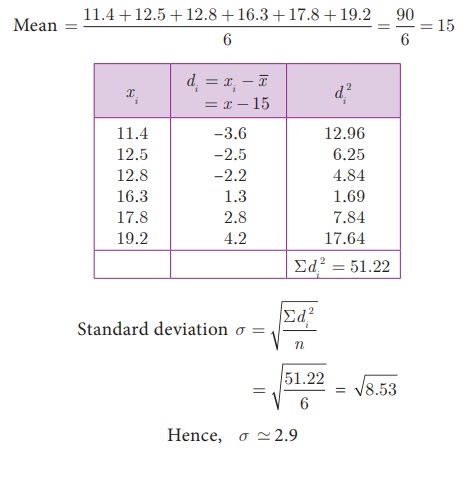
Example 8.5 The amount of rainfall
in a particular season for 6 days are given as 17.8 cm, 19.2 cm,
16.3 cm, 12.5 cm, 12.8 cm and 11.4 cm. Find its standard deviation.
Solution Arranging the numbers in
ascending order we get, 11.4, 12.5, 12.8, 16.3, 17.8, 19.2.
Number of observations n
= 6
(iii) Assumed Mean method
When the mean value is
not an integer (since calculations are very tedious in decimal form) then it is
better to use the assumed mean method to find the standard deviation.
Let x 1
, x2, x 3 , ..., xn
be the given data values and let ![]() be their mean.
be their mean.
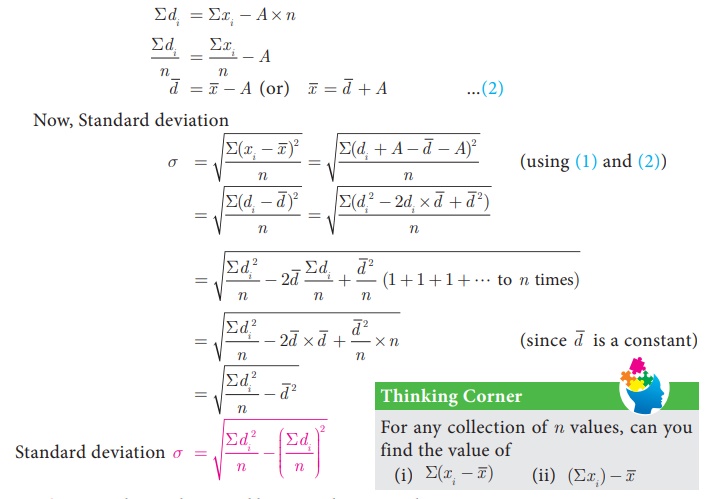
Let di be the deviation of xi from the assumed mean A, which is usually the middle value or near the middle value of the given data.
di= xi − A gives, xi
= di + A ...(1)
Σdi= Σ(xi −A)
= Σxi −(A + A + A + . . . to n times)
Σdi = Σxi
– A × n
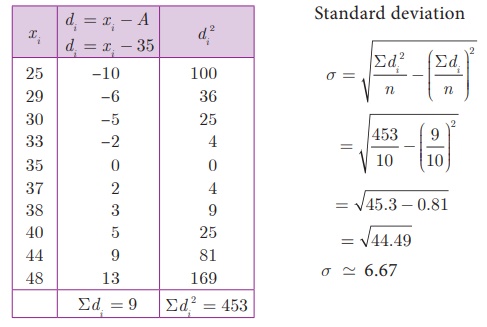
Example 8.6 The marks scored by 10 students in a class test are 25, 29, 30, 33, 35, 37, 38, 40, 44, 48. Find the standard deviation.
Solution The mean of marks is 35.9 which is not an integer.
Hence we take assumed mean,
A = 35, n
= 10 .
(iv) Step deviation method
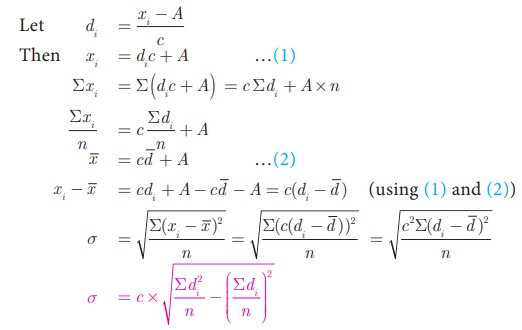
Let x 1
, x2, x 3 ,...xn be
the given data. Let A be the assumed mean.
Let c be the
common divisor of x i - A .
Note
We can use any of the
above methods for finding the standard deviation
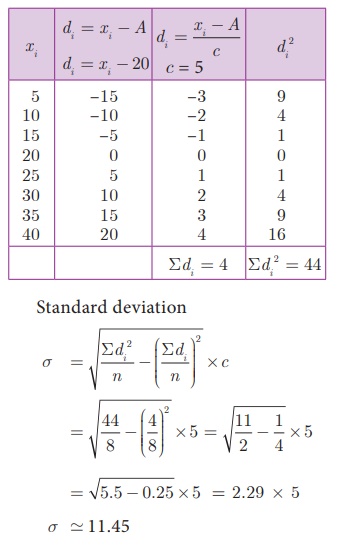
Example 8.7 The amount that the
children have spent for purchasing some eatables in one day trip of a school
are 5, 10, 15, 20, 25, 30, 35, 40. Using step deviation method, find the
standard deviation of the amount they have spent.
Solution We note that all the
observations are divisible by 5. Hence we can use the step deviation
method. Let the Assumed mean A = 20, n = 8.
Example 8.8 Find the standard
deviation of the following data 7, 4, 8, 10, 11. Add 3 to all the values
then find the standard deviation for the new values.
Solution Arranging the values in
ascending order we get, 4, 7, 8, 10, 11 and n = 5
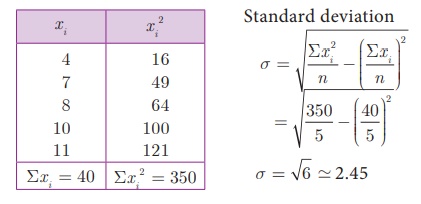
When we add 3 to all the
values, we get the new values as 7,10,11,13,14.
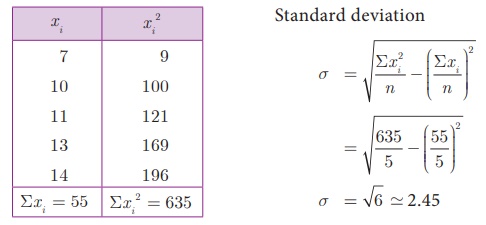
From the above, we see
that the standard deviation will not change when we add some fixed constant to
all the values.
Example 8.9 Find the standard
deviation of the data 2, 3, 5, 7, 8. Multiply each data by 4. Find the
standard deviation of the new values.
Solution Given, n = 5
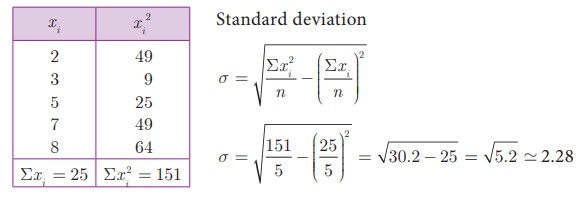
When we multiply each
data by 4, we get the new values as 8, 12, 20, 28, 32.

From the above, we see
that when we multiply each data by 4 the standard deviation also get multiplied
by 4.
Example 8.10 Find the mean and
variance of the first n natural numbers.
Solution
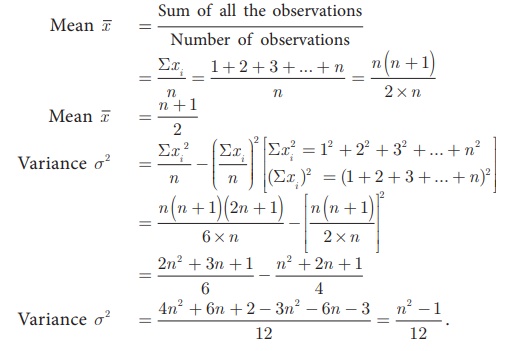
Calculation of Standard deviation for grouped data
(i) Mean method
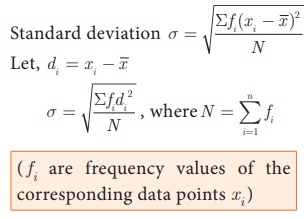
Example 8.11
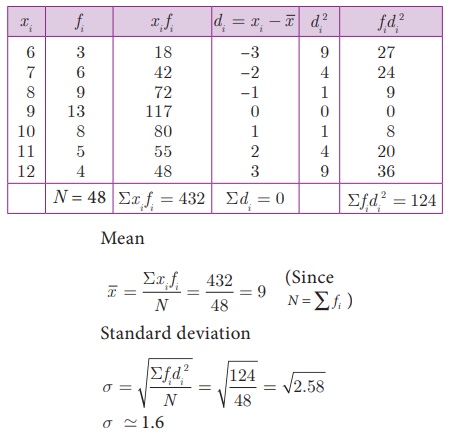
48 students were asked to
write the total number of hours per week they spent on watching television. With this
information find the standard deviation of hours spent for watching television.

Solution
(ii) Assumed Mean Medthod
Let x 1
, x2, x 3 , ...xn be the
given data with frequencies f1 , f2, f3
, ... fn respectively. Let x be their mean and A
be the assumed mean..

Example 8.12
The marks scored by the
students in a slip test are given below.

Find the standard
deviation of their marks.
Solution
Let the assumed mean, A
= 8

2. Calculation of Standard deviation for continuous frequency distribution
(i) Mean method
Standard deviation  where xi
= Middle value of the i th class.
fi =
Frequency of the i th class.
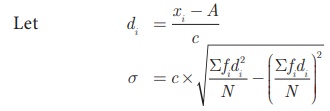
(ii) Shortcut method (or) Step deviation method
To make the calculation
simple, we provide the following formula. Let A be the assumed mean, xi
be the middle value of the ith class and c is the
width of the class interval.
Example 8.13
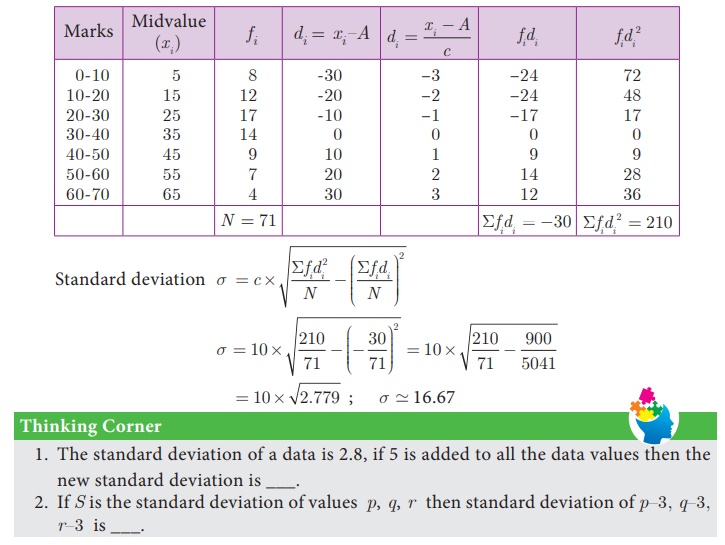
Marks of the students in
a particular subject of a class are given below.

Find its standard
deviation.
Solution
Let the assumed mean, A = 35, c = 10
Example 8.14
The mean and standard
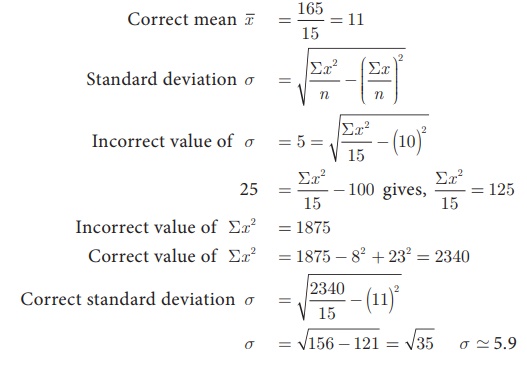
deviation of 15 observations are found to be 10 and 5 respectively. On rechecking it was found that
one of the observation with value 8 was incorrect. Calculate the correct mean
and standard deviation if the correct observation value was 23?
Solution

Wrong observation value
= 8, Correct observation value = 23.
Correct total = 150 − 8
+ 23 = 165
Related Topics