Formula, Solved Example Problems | Statistics | Mathematics - Coefficient of Variation | 10th Mathematics : UNIT 8 : Statistics And Probability
Chapter: 10th Mathematics : UNIT 8 : Statistics And Probability
Coefficient of Variation
Coefficient
of Variation
Comparison of two data
in terms of measures of central tendencies and dispersions in some cases will
not be meaningful, because the variables in the data may not have same units of
measurement.
For example consider the
two data

Here we cannot compare
the standard deviations 1. 5kg and ₹21.60. For comparing two or more data for
corresponding changes the relative measure of standard deviation, called “Coefficient of
variation”
is used.
Coefficient of variation
of a data is obtained by dividing the standard deviation by the arithmetic
mean. It is usually expressed in terms of percentage. This concept is suggested
by one of the most prominent Statistician Karl Pearson.
Thus, coefficient of
variation of first data (C.V1) = σ1/x1 ×100% 
and coefficient of
variation of second data (C.V2) = σ2/ x2 × 100% 
The data with lesser
coefficient of variation is more consistent or stable than the other data.
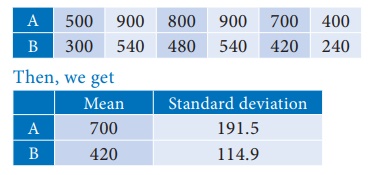
Consider the two data

If we compare the mean
and standard deviation of the two data, we think that the two datas are
entirely different. But mean and standard deviation of B are 60% of that
of A. Because of the smaller mean the smaller standard deviation led to
the misinterpretation.
To compare the
dispersion of two data, coefficient of variation = σ/x ×100% 
The coefficient of
variation of A = 191. 5/700 ×100% = 27. 4%
The coefficient of
variation of B = 114. 9/420 ×100% = 27. 4%
Thus the two data have
equal coefficient of variation. Since the data have equal coefficient of
variation values, we can conclude that one data depends on the other. But the
data values of B are exactly 60% of the corresponding data values of A.
So they are very much related. Thus, we get a confusing situation.
To get clear picture of
the given data, we can find their coefficient of variation. This is why we need
coefficient of variation.
Example 8.15
The mean of a data is
25.6 and its coefficient of variation is 18.75. Find the standard deviation.
Solution
Mean ![]() = 25. 6 , Coefficient of variation, C.V. = 18.75
= 25. 6 , Coefficient of variation, C.V. = 18.75
Coefficient of
variation, C.V. = σ/![]() ×100%
×100%

Example 8.16
The following table
gives the values of mean and variance of heights and weights of the 10th
standard students of a school.

Which is more varying
than the other?
Solution
For comparing two data,
first we have to find their coefficient of variations
Mean ![]() 1=
155cm, variance σ12 = 72. 25 cm2
1=
155cm, variance σ12 = 72. 25 cm2
Therefore standard
deviation σ1 = 8. 5
Coefficient of variation

Mean ![]() 2 = 46.50
kg, Variance σ22 = 28.09 kg2
2 = 46.50
kg, Variance σ22 = 28.09 kg2
Standard deviation σ2
= 5. 3kg
Coefficient of variation

= 11. 40%
(for weights)
C .V1
= 5.48% and C .V2 = 11.40%
Since C .V2
> C .V1 , the weight of the students is more
varying than the height.
Example 8.17
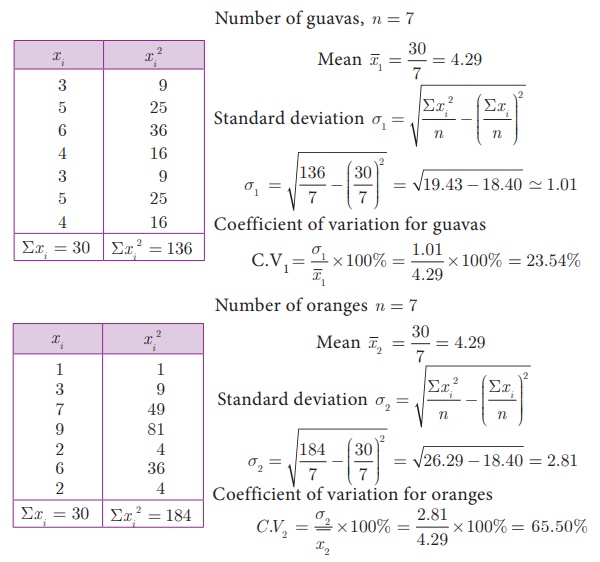
The consumption of
number of guava and orange on a particular week by a family are given
below.

Which fruit is consistently consumed
by the family?
Solution
First we find the
coefficient of variation for guavas and oranges separately.

C .V1 =
23.54% , C .V2 = 65.50% Since, C .V1<C
.V2 , we can
conclude that the consumption of
guavas is more consistent than oranges.
Related Topics