Statistics and Probability - Introduction | 10th Mathematics : UNIT 8 : Statistics And Probability
Chapter: 10th Mathematics : UNIT 8 : Statistics And Probability
Introduction
STATISTICS AND
PROBABILITY
“Life is a School of Probability” - Walter Bagehot
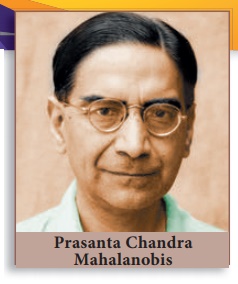
Prasanta Chandra Mahalanobis, born
at Kolkata, was an Indian statistician who devised a measure of comparison
between two data sets. He introduced innovative techniques for conducting
large-scale sample surveys and calculated acreages and crop yields by using the
method of random sampling. For his pioneering work, he was awarded the Padma
Vibhushan, one of India’s highest honours, by the Indian government in 1968 and
he is hailed as “Father of Indian Statistics”. The Government of India has
designated 29th June every year, coinciding with his birth anniversary, as
“National Statistics Day”.

Learning Outcomes
·
To
recall the measures of central tendency.
·
To
recall mean for ungrouped and grouped data.
·
To
understand the concept of dispersion.
·
To
understand and compute range, standard deviation, variance and coefficient of
variation.
·
To
understand random experiments, sample space and use of a tree diagram.
·
To
define and describe different types of events of a random experiment.
·
To
understand addition theorem of probability and apply it in solving some simple
problems.
Introduction
‘STATISTICS’ is derived from the
Latin word ‘status’ which means a political state. Today, statistics has become
an integral part of everyone’s life, unavoidable whether making a plan for our
future, doing a business, a marketing research or preparing economic reports.
It is also extensively used in opinion polls, doing advanced research. The
study of statistics is concerned with scientific methods for collecting,
organising, summarising, presenting, analysing data and making meaningful
decisions. In earlier classes we have studied about collection of data,
presenting the data in tabular form, graphical form and calculating the
Measures of Central Tendency. Now, in this class, let us study about the
Measures of Dispersion.
Recall
Measures of Central Tendency
It is often convenient
to have one number that represent the whole data. Such a number is called a Measures of Central
Tendency.
The Measures of Central
Tendency usually will be near to the middle value of the data. For a given data
there exist several types of measures of central tendencies.
The most common among
them are
• Arithmetic Mean
• Median
• Mode
Thinking Corner: Does the mean, median
and mode are same for a given data? What is the difference between the arithmetic
mean and average?
Note
Data : The numerical representation of facts is called data.
Observation : Each entry in the data is called an
observation.
Variable : The quantities which are being considered in a survey are
called variables. Variables are generally denoted by xi, i=1,2,3,…,n.
Frequencies : The number of times, a variable occurs in a
given data is called the frequency of that variable. Frequencies are generally
denoted as fi, i=1,2,3,…,n.
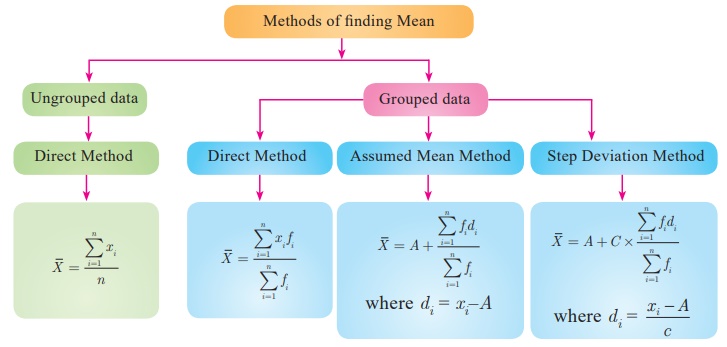
In this class we have to
recall the Arithmetic Mean.
Arithmetic Mean
The Arithmetic Mean or
Mean of the given values is sum of all the observations divided by the total
number of observations. It is denoted by ![]() (pronounced as x
bar)
(pronounced as x
bar)
![]() = Sum of all the
observations / Number of observations
= Sum of all the
observations / Number of observations


We apply the respective
formulae depending upon the information provided in the problem.
Related Topics