Chapter: Power Quality : Harmonics
Effects of Harmonics
Effects of Harmonics:
1. Introduction
Harmonics
in electrical system result in waveform distortion. The are periodic
disturbance in voltage and current. Any noon sinusoidal periodic waveforms can
be considered as combination of sine waveform of certain frequency, amplitude
and phase angle. Generally these are individual multiple of fundamental
frequency. Hence 3rd order frequency has got frequency of 150 Hz,
and the 5th order harmonic has 250 frequency and so on. The
amplitude and phase angle of individual components will vary depending on the
nature of distorted waveform.
THD is
defined as the ratio of the root mean square value of the harmonic content to
root mean square value of the fundamental quantity, expressed as percent of the
fundamental. It is measured of effective value of harmonic distortion.
The total
harmonic value of
distortion (THD) is
the value used
to describe the characteristics of distorted waveform.
The THD is a measured of how badly the waveform is distorted from pure
sinusoidal the THD is 0%. IEEE standard 519 recommends that for most system,
the THD of the bus voltage should be less than 5% with maximum of 3% with any
individual components.
2. Harmonic Distortion
Harmonic
distortion is caused by nonlinear devices in the power system. A nonlinear
device is one in which the current is not proportional to the applied voltage.
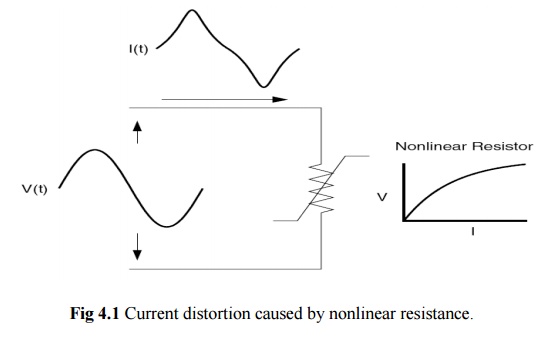
Figure 4.1 illustrates this concept by the case of a sinusoidal voltage applied
to a simple nonlinear resistor in which the voltage and current vary according
to the curve shown. While the applied voltage is perfectly sinusoidal, the
resulting current is distorted. Increasing the voltage by a few percent may
cause the current to double and take on a different wave shape. This is the
source of most harmonic distortion in a power system.
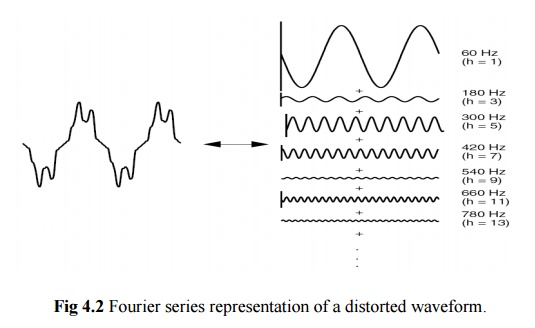
Figure
4.2 illustrates that any periodic, distorted waveform can be expressed as a sum
of sinusoids. When a waveform is identical from one cycle to the next, it can
be represented as a sum of pure sine waves in which the frequency of each
sinusoid is an integer multiple of the fundamental frequency of the distorted
wave. This multiple is called a harmonic
of the fundamental, hence the name of this subject matter. The sum of sinusoids
is referred to as a
Fourier series, named after the great mathematician
who discovered the concept.
Because
of the above property, the Fourier series concept is universally applied in
analyzing harmonic problems. The system can now be analyzed separately at each
harmonic. In addition, finding the system response of a sinusoid of each
harmonic individually is much more straightforward compared to that with the
entire distorted waveforms. The outputs at each frequency are then combined to
form a new Fourier series, from which the output waveform may be computed, if
desired. Often, only the magnitudes of the harmonics are of interest.
When both
the positive and negative half cycles of a waveform have identical shapes, the
Fourier series contains only odd
harmonics. This offers a further simplification for most power system studies
because most common harmonic-producing devices look the same to both
polarities. In fact, the presence of even harmonics is often a clue that there
is something wrong— either with the load equipment or with the transducer used
to make the measurement. There are notable exceptions to this such as half-wave
rectifiers and arc furnaces when the arc is random.
Usually,
the higher-order harmonics (above the range of the 25th to 50th, depending on
the system) are negligible for power system analysis. While they may cause
interference with low-power electronic devices, they are usually not damaging
to the power system. It is also difficult to collect sufficiently accurate data
to model power systems at these frequencies.
A common
exception to this occurs when there are system resonances in the range of
frequencies. These resonances can be excited by notching or switching
transients in electronic power converters. This causes voltage waveforms with
multiple zero crossings which disrupt timing circuits. These resonances
generally occur on systems with underground cable but no power factor
correction capacitors.
If the
power system is depicted as series and shunt elements, as is the conventional
practice, the vast majority of the nonlinearities in the system are found in shunt elements (i.e., loads). The series
impedance of the power delivery system (i.e., the short-circuit impedance
between the source and the load) is remarkably linear. In transformers, also,
the source of harmonics is the shunt branch (magnetizing impedance) of the
common “T” model; the leakage impedance is linear. Thus, the main sources of
harmonic distortion will ultimately be end-user loads. This is not to say that
all end users who experience harmonic distortion will themselves have significant
sources of harmonics, but that the harmonic distortion generally originates
with some end-user’s load or combination of loads.
3. Voltage versus Current
Distortion
The word
harmonics is often used by itself without further qualification. For example,
it is common to hear that an adjustable-speed drive or an induction furnace
can’t operate properly because of harmonics. What does that mean? Generally, it
could mean one of the following
Three
things:
1. The
harmonic voltages are too great (the voltage too distorted) for the control to
properly determine firing angles.
2. The
harmonic currents are too great for the capacity of some device in the power
supply system such as a transformer, and the machine must be operated at a
lower than rated power.
3. The
harmonic voltages are too great because the harmonic currents produced by the
device are too great for the given system condition.
As
suggested by this list, there are separate causes and effects for voltages and
currents as well as some relationship between them. Thus, the term harmonics by
itself is inadequate to definitively describe a problem.
Nonlinear
loads appear to be sources of harmonic current in shunt with and injecting
harmonic currents into the power system. For nearly all analyses, it is
sufficient to treat these harmonic-producing loads simply as current sources.
There are exceptions to this as will be described later.
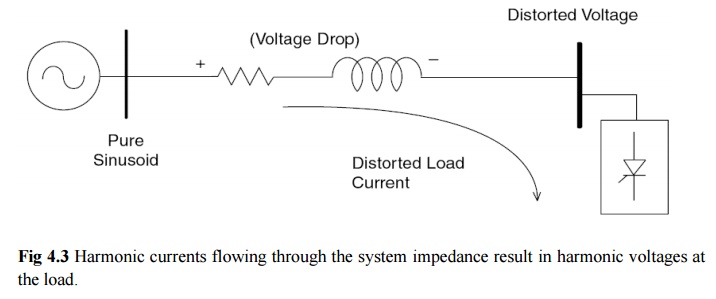
As Fig.
4.3 shows, voltage distortion is the result of distorted currents passing
through the linear, series impedance of the power delivery system, although,
assuming that the source bus is ultimately a pure sinusoid, there is a
nonlinear load that draws a distorted current. The harmonic currents passing
through the impedance of the systemcause a voltage drop for each harmonic. This
results in voltage harmonics appearing at the load bus. The amount of voltage
distortion depends on the impedance and the current. Assuming the load bus
distortion stays within reasonable limits (e.g., less than 5 percent), the
amount of harmonic current produced by the load is generally constant.
While the
load current harmonics ultimately cause the voltage distortion, it should be
noted that load has no control over the voltage distortion. The same load put
in two different locations on the power system will result in two different
voltage distortion values. Recognition of this fact is the basis for the
division of responsibilities for harmonic control that are found in standards
such as IEEE Standard 519-1992, Recommended
Practices and Requirements for
Harmonic
Control in Electrical Power Systems:
1. The
control over the amount of harmonic current injected into the system takes
place at the end-use application.
2. Assuming
the harmonic current injection is within reasonable limits, the control over
the voltage distortion is exercised by the entity having control over the
system impedance, which is often the utility.
One must
be careful when describing harmonic phenomena to understand that there are
distinct differences between the causes and effects of harmonic voltages and
currents. The use of the term harmonics should be qualified accordingly. By
popular convention in the power industry, the majority of times when the term
is used by itself to refer to the load apparatus, the speaker is referring to
the harmonic currents. When referring to the utility system, the voltages are
generally the subject. To be safe, make a habit of asking for clarification.
4. Harmonic Indices:
The two
most commonly used indices for measuring the harmonic content of a waveform are
the total harmonic distortion and the total demand distortion. Both are
measures of the effective value of a waveform and may be applied to either
voltage or current.
5. Total harmonic distortion(THD)
The THD
is a measure of the effective value
of the harmonic components of a distorted waveform. That is, it is the
potential heating value of the harmonics relative to the fundamental. This
index can be calculated for either voltage or current:
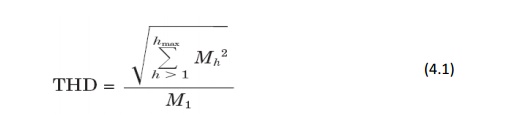
where Mh is the rms value of harmonic
component h of the quantity M.
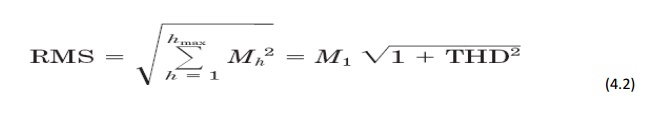
The rms
value of a distorted waveform is the square root of the sum of the squares as
shown in Eqs. (4.1) and (4.2). The THD is related to the rms value of the
waveform as follows:
The THD
is a very useful quantity for many applications, but its limitations must be
realized. It can provide a good idea of how much extra heat will be realized
when a distorted voltage is applied across a resistive load. Likewise, it can
give an indication of the additional losses caused by the current flowing
through a conductor. However, it is not a good indicator of the voltage stress
within a capacitor because that is related to the peak value of the voltage
waveform, not its heating value.
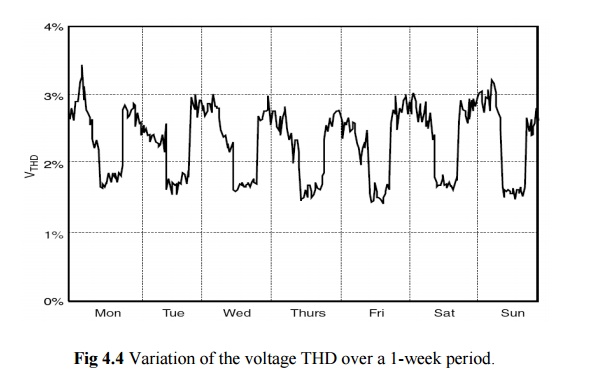
The THD
index is most often used to describe voltage harmonic distortion. Harmonic
voltages are almost always referenced to the fundamental value of the waveform
at the time of the sample. Because fundamental voltage varies by only a few
percent, the voltage THD is nearly always a meaningful number. Variations in
the THD over a period of time often follow a distinct pattern representing
nonlinear load activities in the system. Figure 4.4 shows the voltage THD
variation over a 1-week period where a daily cyclical pattern is obvious. The
voltage THD shown in Fig. 4.4 was taken at a 13.2-kV distribution substation
supplying a residential load. High-voltage THD occurs at night and during the
early morning hours since the nonlinear loads are relatively high compared to
the amount of linear load during these hours. A 1-week observation period is
often required to come up with a meaningful THD pattern since it is usually the
shortest period to obtain representative and reproducible measurement results.
6. Total demand distortion(TDD)
Current
distortion levels can be characterized by a THD value, as has been described,
but this can often be misleading. A small current may have a high THD but not
be a significant threat to the system. For example, many adjustable-speed
drives will exhibit high THD values for the input current when they are
operating at very light loads. This is not necessarily a significant concern
because the magnitude of harmonic current is low, even though its relative current
distortion is high.
Some analysts have attempted to avoid this difficulty by referring THD to the fundamental of the peak demand load current rather than the fundamental of the present sample. This is called total demand distortion and serves as the basis for the guidelines in IEEE Standard 519-1992, Recommended Practices and Requirements for Harmonic Control in Electrical Power Systems. It is defined as follows:
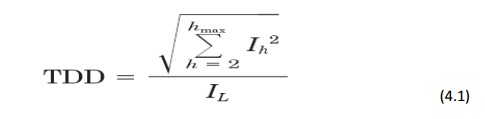
IL is the peak, or maximum, demand
load current at the fundamental frequency component measured at the point of common coupling (PCC). There are two ways
to measure IL. With a load
already in the system, it can be calculated as the average of the maximum
demand current for the preceding 12 months. The calculation can simply be done
by averaging the 12-month peak demand readings. For a new facility, IL has to be estimated based
on the predicted load profiles.
Related Topics