Chapter: 11th 12th standard bio zoology Human Body higher secondary school
ECG-Electrocardiogram
ECG-Electrocardiogram
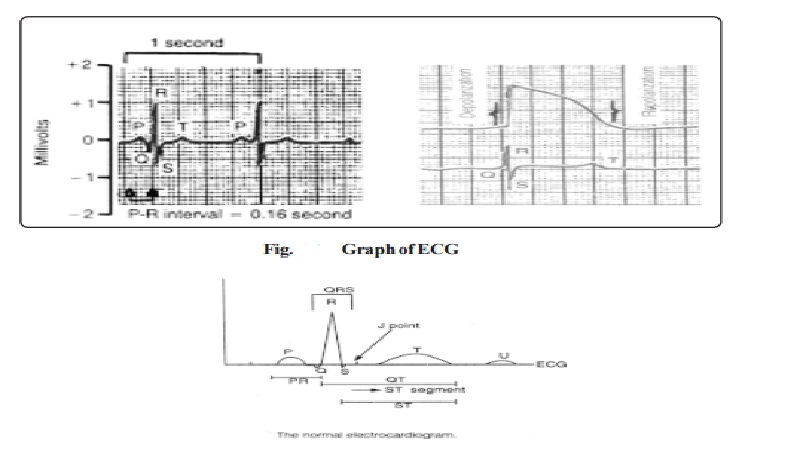
The electrocardiogram (ECG) is a record of the electric potential changes that occur in the heart during the cardiac cycle. It is recorded from the surface of the body. The instrument used to record the ECG is called Electrocardiogram. The waves of the ECG are due to depolarization and not due to contraction of the heart. This wave of depolarization occurs first before the contraction of the cardiac muscle begins.
The electrical activity of the heart was first recorded by Waller in 1887 with a capillary electrometer. But the work of Einthoven who recorded the ECG with a strong galvanometer only lead to the development of modern electrocardiography. Einthovan was awarded Nobel Prize in 1924.
A normal ECG is composed of five waves designated from left to right with the letters P,Q,R,S and T. P,R and T are normally upward or positive waves while Q and S are downward or negative waves.
ECG-'PQRST' wave
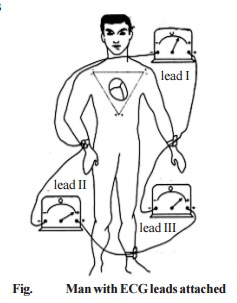
When the cardiac impulse (originating in sinus node which is the primary pace maker) passes through the heart, electrical currents spread in the tissues surrounding the heart. A small amount of this current spreads to the surface of the body. If electrodes are placed on the skin on opposite sides of the heart, electric potentials generated by these currents can be recorded. This recording is known as electrocardiogram (ECGorEKG).
P.Wave: It occurs in the auricles. It is an atrial wave. It is due to the spread of depolarisation in the atria (auricles). Its duration is 0.1 second and it occurs just before the atrial systole. Its amplitude is about 0.1 to 0.3 mv.The cardiac impulse reaches the sinu-auricular node at about the summit of the Pwave. The P wave is a guide to the activity of atria.
Q,R, and S Waves
After the completion of P wave, the isoelectric interval occurs. Following this, QR and S waves begin. Q wave is a small negative downward deflection. It is mostly indistinct. It represents atrial septal depolarization. R wave is a prominent positive wave and S wave is a small negative wave. R and S are due to depolarization of the ventricular muscle. The duration of the QRS complex is about 0.08 second and usually does not exceed 0.1second. The average amplitude to R wave is about 1 mv. Lot of diagnostic information can be gained from alteration in the QRS complex.
T wave
Following S wave there is an isoelectric interval. T wave begins after that. It is due to ventricular repolarization. It is a broad wave. Its average duration is about 0.27 second and amplitude 0.15 to 0.5 mv.
Related Topics