Chapter: Embedded and Real Time Systems : Computing Platform and Design Analysis
Development and Debugging
DEVELOPMENT
AND DEBUGGING:
Development Environments
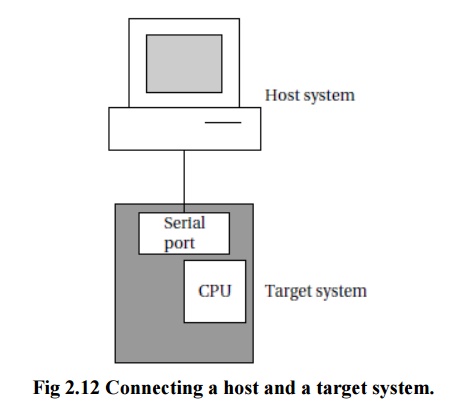
A typical
embedded computing system has a relatively small amount of everything,
including CPU horsepower, memory, I/O devices, and so forth. As a result, it is
common to do at least part of the software development on a PC or workstation
known as a host as illustrated in Figure 2.12. The hardware on which the
code will finally run is known as the target. The host and target are
frequently connected by a USB link, but a higher-speed link such as Ethernet
can also be used.
The
target must include a small amount of software to talk to the host system. That
software will take up some memory, interrupt vectors, and so on, but it should
generally leave the smallest possible footprint in the target to avoid
interfering with the application software.
The host
should be able to do the following:
load
programs into the target,
start and
stop program execution on the target, and
examine
memory and CPU registers.
Debugging Techniques:
A good
deal of software debugging can be done by compiling and executing the code on a
PC or workstation. But at some point it inevitably becomes necessary to run
code on the embedded hardware platform.
Embedded
systems are usually less friendly programming environments than PCs.
Nonetheless, the resourceful designer has several options available for
debugging the system.
The
serial port found on most evaluation boards is one of the most important
debugging tools. In fact, it is often a good idea to design a serial port into
an embedded system even if it will not be used in the final product; the serial
port can be used not only for development debugging but also for diagnosing
problems in the field.
Another
very important debugging tool is the breakpoint. The simplest form of a
breakpoint is for the user to specify an address at which the program’s
execution is to break. When the PC reaches that address, control is returned to
the monitor program. From the monitor program, the user can examine and/or
modify CPU registers, after which execution can be continued. Implementing
breakpoints does not require using exceptions or external devices.
Debugging Challenges
Logical errors in software can be hard to track down, but errors in
real-time code can create problems that are even harder to diagnose. Real-time
programs are required to finish their work within a certain amount of time; if
they run too long, they can create very unexpected behavior.
The exact results of missing real-time deadlines depend on the detailed
characteristics of the I/O devices and the nature of the timing violation. This
makes debugging real-time problems especially difficult.
Unfortunately, the best advice is that if a system exhibits truly
unusual behavior, missed deadlines should be suspected. In-circuit emulators,
logic analyzers, and even LEDs can be useful tools in checking the execution
time of real-time code to determine whether it in fact meets its deadline.
Related Topics