Chapter: Power Quality : Harmonics
Power System Response Characteristics
Power System Response
Characteristics:
The power
system response characteristics are:
1. The system
impedance characteristics
2. The
presence of a capacitor bank causing resonance
3.
The amount of resistive loads in the system
1. System impedance
At the
fundamental frequency, power systems are primarily inductive, and the
equivalent impedance is sometimes called simply the short-circuit reactance.
Capacitive effects are frequently neglected on utility distribution systems and
industrial power systems. One of the most frequently used quantities in the
analysis of harmonics on power systems is the short-circuit impedance to the
point on a network at which a capacitor is located. If not directly available,
it can be computed from short-circuit study results that give either the
short-circuit mega volt ampere (MVA) or the short-circuit current as follows:
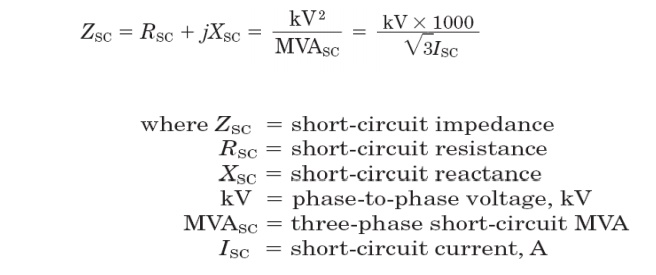
ZSC is a phasor quantity,
consisting of both resistance and reactance. However, if the short-circuit data contain no phase
information, one is usually constrained to assuming that the impedance is
purely reactive. This is a reasonably good assumption for industrial power
systems for buses close to the mains and for most utility systems. When this is
not the case, an effort should be made to determine a more realistic resistance
value because that will affect the results once capacitors are considered. The
inductive reactance portion of the impedance changes linearly with frequency.
One common error made by novices in harmonic analysis is to forget to adjust
the reactance for frequency. The reactance at the hth harmonic is determined from the fundamental impedance reactance
X1 by:
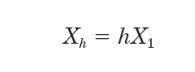
In most
power systems, one can generally assume that the resistance does not change
significantly when studying the effects of harmonics less than the ninth. For
lines and cables, the resistance varies approximately by the square root of the
frequency once skin effect becomes significant in the conductor at a higher
frequency. The exception to this rule is with some transformers.
Because
of stray eddy current losses, the apparent resistance of larger transformers
may vary almost proportionately with the frequency. This can have a very
beneficial effect on damping of resonance as will be shown later. In smaller
transformers, less than 100 kVA, the resistance of the winding is often so
large relative to the other impedances that it swamps out the stray eddy
current effects and there is little change in the total apparent resistance
until the frequency reaches about 500 Hz. Of course, these smaller transformers
may have an X/R ratio of 1.0 to 2.0 at fundamental frequency, while large
substation transformers might typically have a ratio of 20 to 30. Therefore, if
the bus that is being studied is dominated by transformer impedance rather than
line impedance, the system impedance model should be considered more carefully.
Neglecting the resistance will generally give a conservatively high prediction
of the harmonic distortion.
At
utilization voltages, such as industrial power systems, the equivalent system
reactance is often dominated by the service transformer impedance. A good
approximation for XSC may be based on
the impedance of the service entrance transformer only:
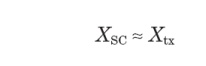
While not
precise, this is generally at least 90 percent of the total impedance and is
commonly more. This is usually sufficient to evaluate whether or not there will
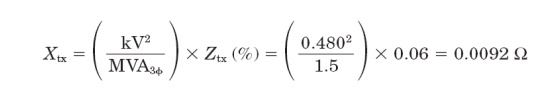
be a significant harmonic resonance problem. Transformer impedance in ohms can
be determined from the percent impedance Ztx
found on the nameplate by
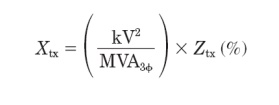
where
MVA3_ is the kVA rating of the transformer. This assumes that the impedance is
predominantly reactive. For example for a 1500-kVA, 6 percent transformer, the
equivalent impedance on the 480-V side is
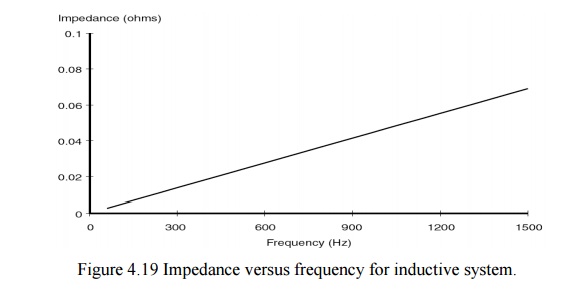
A plot of
impedance versus frequency for an inductive system (no capacitors installed)
would look like Fig. 4.19. Real power systems are not quite as well behaved.
This simple model neglects capacitance, which cannot be done for harmonic
analysis.
2. Capacitor impedance
Shunt
capacitors, either at the customer location for power factor correction or on
the distribution system for voltage control, dramatically alter the system
impedance variation with frequency. Capacitors do not create harmonics, but
severe harmonic distortion can sometimes be attributed to their presence. While
the reactance of inductive components increases proportionately to frequency,
capacitive reactance XC decreases
proportionately:
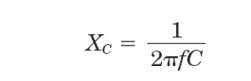
C is the capacitance in farads. This quantity is seldom readily available for power capacitors, which are rated in terms of kvar or Mvar at a given voltage. The equivalent line-to- neutral capacitive reactance at fundamental frequency for a capacitor bank can be determined by
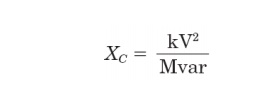
For
three-phase banks, use phase-to-phase voltage and the three phase reactive
power rating. For single-phase units, use the capacitor voltage rating and the
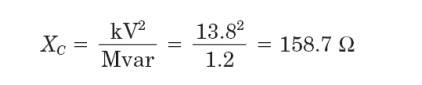
reactive power rating. For example, for a three phase, 1200-kvar, 13.8-kV
capacitor bank, the positive-sequence reactance in ohms would be
Parallel resonance
All
circuits containing both capacitances and inductances have one or more natural
frequencies. When one of those frequencies lines up with a frequency that is
being produced on the power system, a resonance may develop in which the
voltage and current at that frequency continue to persist at very high values.
This is the root of most problems with harmonic distortion on power systems.
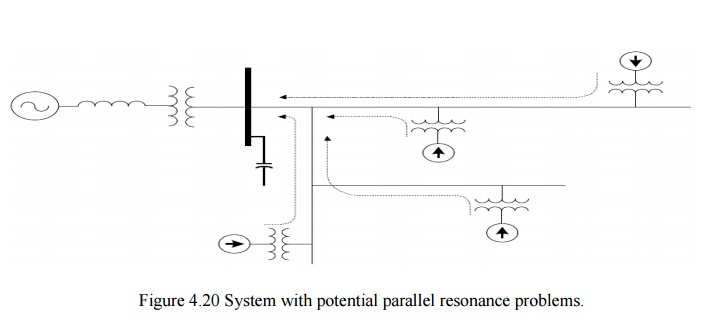
Figure 4.20 shows a distribution system with potential parallel resonance
problems. From the perspective of harmonic sources the shunt capacitor appears
in parallel with the equivalent system inductance (source and transformer
inductances) at harmonic frequencies as depicted in Fig. 4.21b. Furthermore, since the power system
is assumed to have an equivalent voltage source of fundamental frequency only,
the power system voltage source appears short circuited in the figure. Parallel
resonance occurs when the reactance of XC
and the distribution system cancel each other out. The frequency at which this
phenomenon occurs is called the parallel resonant frequency. It can be
expressed as follows:
At the
resonant frequency, the apparent impedance of the parallel combination of the
equivalent inductance and capacitance as seen from the harmonic current source
becomes very large.
Where Q _ XL/R _ XC/R and R XLeq. Keep in mind that the reactance in this equation are
computed at the resonant frequency.
Q often is known as the quality
factor of a resonant circuit that determines the sharpness of the frequency response. Q
varies considerably by location on the power system. It might be less than 5 on
a distribution feeder and more than 30 on the secondary bus of a large
step-down transformer. From Eq. (5.22), it is clear that during parallel
resonance, a small harmonic current can cause a large voltage drop across the
apparent impedance, i.e., Vp = Q XLeq Ih.
The voltage near the capacitor bank will be magnified and heavily distorted.
Let us now examine current behavior during the parallel resonance. Let the
current flowing in the capacitor bank or into the power system be I resonance; thus,
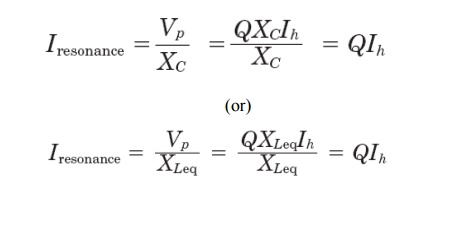
From Eq.
It is clear that currents flowing in the capacitor bank and in the power system
(i.e., through the transformer) will also be magnified Q times. This phenomenon wills likely cause capacitor failure, fuse
blowing, or transformer overheating.
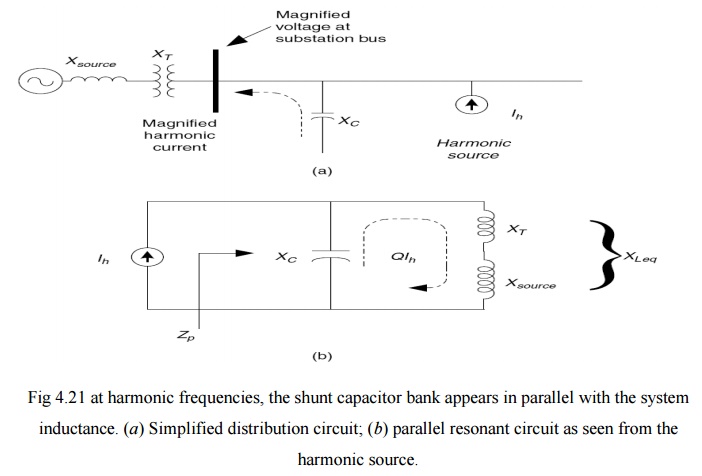
Fig 4.21
at harmonic frequencies, the shunt capacitor bank appears in parallel with the
system inductance. (a) Simplified
distribution circuit; (b) parallel
resonant circuit as seen from the harmonic source.
The
extent of voltage and current magnification is determined by the size of the
shunt capacitor bank. Fig 4.22 shows the effect of varying capacitor size in
relation to the transformer on the impedance seen from the harmonic source and
compared with the case in which there is no capacitor. The following
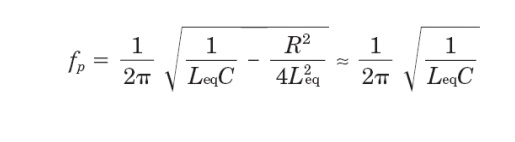
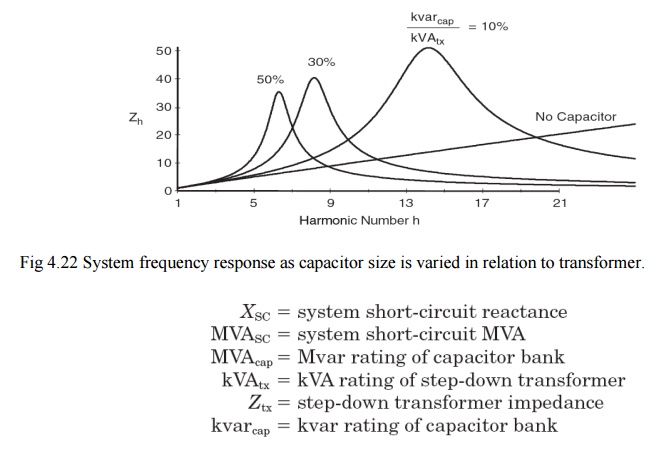
illustrates how the parallel resonant frequency is computed. Power systems
analysts typically do not have L and C readily available and prefer to use
other forms of this relationship. They commonly compute the resonant harmonic hr based on fundamental frequency
impedances and ratings using one of the following:
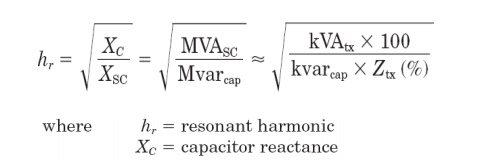
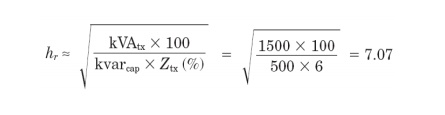
For
example, for an industrial load bus where the transformer impedance is
dominant, the resonant harmonic for a 1500-kVA, 6 percent transformer and a
500-kvar capacitor bank is approximately
4. Series resonance
There are
certain instances when a shunt capacitor and the inductance of a transformer or
distribution line may appear as a series LC
circuit to a source of harmonic currents. If the resonant frequency corresponds
to a characteristic harmonic frequency of the nonlinear load, the LC circuit will attract a large portion
of the harmonic current that is generated in the distribution system. A customer having no nonlinear
load, but utilizing power factor correction capacitors, may in this way
experience high harmonic voltage distortion due to neighboring harmonic sources.
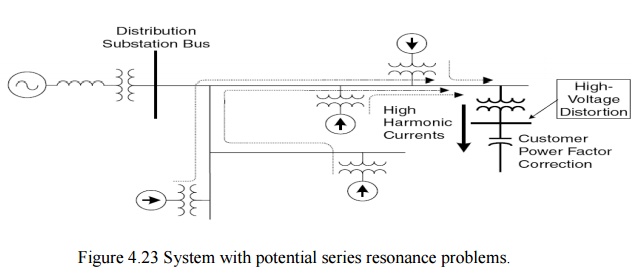
This situation is depicted in Fig. 4.23.
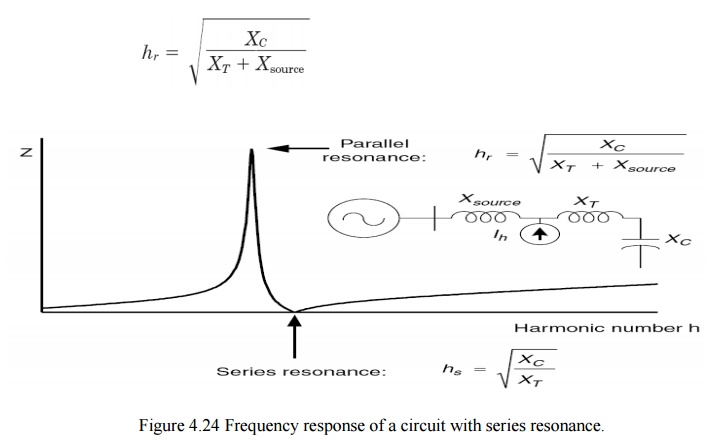
During
resonance, the power factor correction capacitor forms a series circuit with
the transformer and harmonic sources. The simplified circuit is shown in Fig.
4.24. The harmonic source shown in this figure represents the total harmonics
produced by other loads. The inductance in series with the capacitor is that of
the service entrance transformer. The series combination of the transformer
inductance and the capacitor bank is very small (theoretically zero) and only
limited by its resistance. Thus the harmonic current corresponding to the
resonant frequency will flow freely in this circuit. The voltage at the power
factor correction capacitor is magnified and highly distorted. This is apparent
from the following equation:

where Vh and Vs are the harmonic voltage corresponding to the harmonic current Ih and the voltage at the power factor
capacitor bank, respectively. The resistance R of the series resonant circuit is not shown in Fig. 4.24, and it
is small compared to the reactance.
The
negligible impedance of the series resonant circuit can be exploited to absorb
desired harmonic currents. This is indeed the principle in designing a notch
filter. In many systems with potential series resonance problems, parallel
resonance also arises due to the circuit topology. One of these is shown in
Fig. 4.24 where the parallel resonance is formed by the parallel combination
between X source and a series between
XT and XC. The resulting parallel resonant frequency is always smaller
than its series resonant frequency due to the source inductance contribution.
The parallel resonant frequency can be represented by the following equation:
Related Topics