Chapter: 11th Computer Technology : Chapter 13 : Presentation Advanced
Inserting tables and charts - OpenOffice presentation
Inserting
tables and charts
To
create a table proceed as follows:
1.
Position the slide which will contain the table in the workarea. If necessary
modify the slide layout in order to reserve the place for the table.
2.
If the task pane is already open select Table Design. If the task pane is not
visible, select View → Task pane, then select the Table Design task.
3.
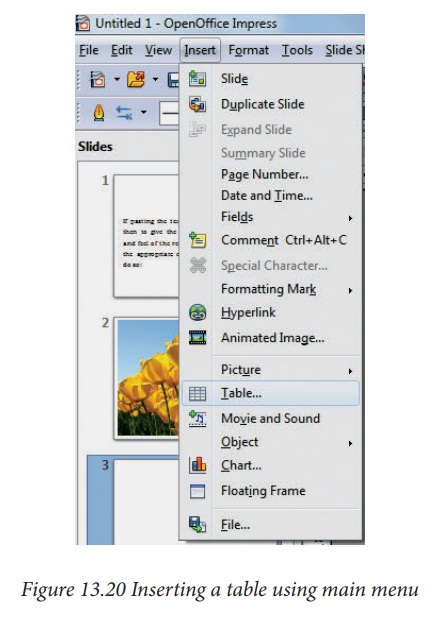
You can create a table directly by selecting Insert → Table from the main menu: the default style and settings are
applied to the newly created table. (Figure
13.20)
4.
Select one of the predefined styles. You will be able to change the color
scheme.
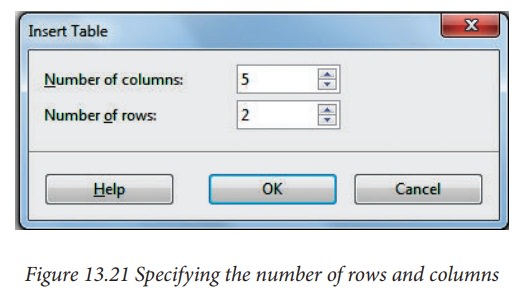
5.
Selecting a style opens the dialog box of Figure
13.21, where you can specify the number of rows and columns.
The
table is placed at the center of the slide, but you can move it wherever it is
more convenient by selecting it then dragging it in the new position.
Table toolbar
When
a table is selected, the Table toolbar (Figure
13.22) should be displayed. If necessary, you can open the toolbar using View → Toolbars → Table. By default the toolbar will float, but you can fix it to the
side or top of the work area wherever you want.
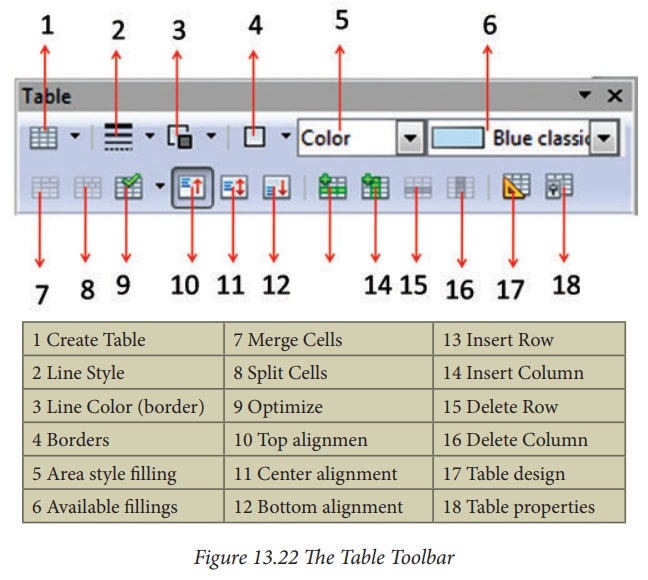
The
Table toolbar contains the majority of the tools you need to manipulate a
table.
Deleting a table
To
delete a table, select it and then press the Delete key on thekeyboard.
Inserting a chart
To
creating a chart using the Insert Chart feature do the following:
1.
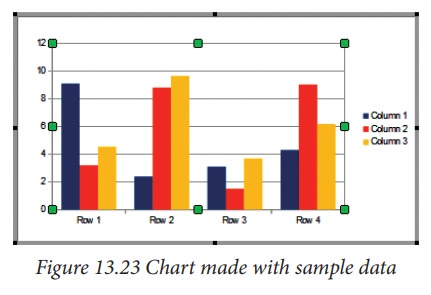
Select Insert → Chart, or click
the Insert Chart icon on the Standard toolbar. A chart appears that has been
created using sample data. See Figure
13.23.
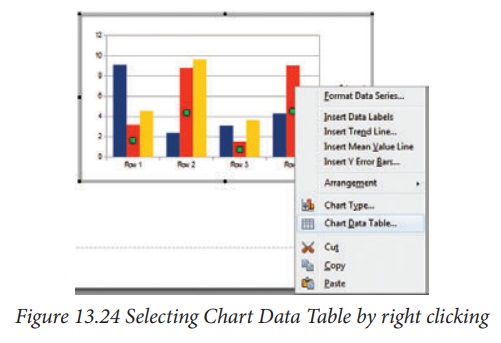
2.
To enter your own data in the chart, select Chart Data Table by right clicking the chart made with sample data.
(Figure 13.24)
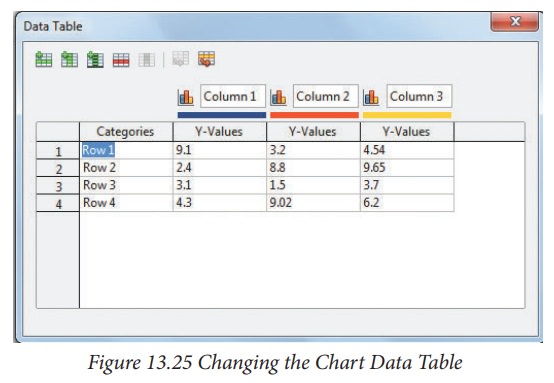
3.
A table with predefined data’s will be seen. You can change the data as per
your need. (Figure 13.25)
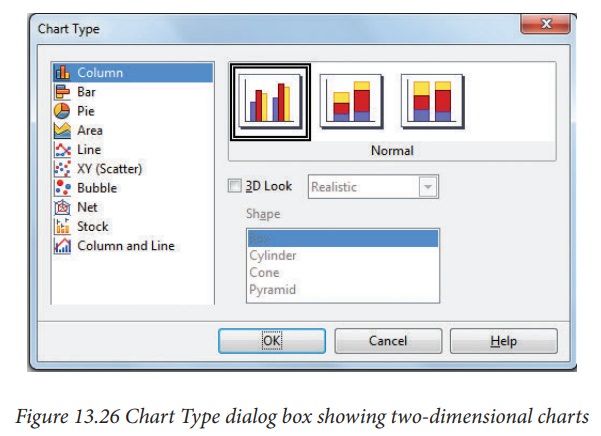
4.
A wide range of chart types and variations are available. You can choose any
chart. (Figure 13.26)
Related Topics