Chapter: 12th Botany : Chapter 7 : Ecosystem
Functions of ecosystem
Functions of ecosystem
The function of ecosystem include to energy creation, sharing of
energy and cycling of materials between the living and nonliving component of
an ecosystem.
Before studying the productivity in any ecosystem, We should
understand the essential role of sunlight used by producers of the first
trophic level. The quantity of sunlight is directly proportional to the
production of energy by plants.
1. Photosynthetically Active Radiation (PAR)
The amount of light available for photosynthesis of plants is
called Photosynthetically Active Radiation (PAR) which is
between the range of 400-700 nm wave length. It is essential for
photosynthesis and plant growth. PAR is not always constant because of clouds,
tree shades, air, dust particles, seasons, latitudes and length of the daylight
availability. Generally plants absorb more blue and red light for efficient
photosynthesis.
Of the total sunlight, 34 percent that reaching the atmosphere is
reflected back into the atmosphere, moreover 10% is held by ozone, water
vapours and atmospheric gases and the remaining 56% reaches the earth’s
surface. Out of this 56%, only 2 – 10% of the solar energy is used by green
plants for photosynthesis while the remaining portion is dissipated as heat.
PAR is generally reported as millimoles / square meter / second by
using silicon photo voltic detectors which detect only 400 – 700 nm wavelength
of light. PAR values range from 0 to 3000 millimoles /square meter / second. At
night PAR is zero and during midday in the summer, PAR often reaches 2000 –
3000 millimoles /square meter/second.
2. Productivity of an ecosystem
The rate of biomass production per unit area in a unit time is
called productivity. It can be expressed in terms of gm /m2/year or Kcal/m2/
year. It is classified as given bellow.
1. Primary productivity
2. Secondary productivity
3. Community productivity
1.
Primary productivity:
The chemical energy or organic matter generated by autotrophs
during the process of photosynthesis and chemosynthesis is called primary
productivity. It is the source of energy for all organisms, from bacteria
to human.
a. Gross Primary Productivity (GPP)
The total amount of food energy or organic matter or biomass
produced in an ecosystem by autotrophsthroughtheprocessofphotosynthesis is
called gross primary productivity
b. Net Primary Productivity (NPP)
The proportion of energy which remains after respiration loss in
the plant is called net primary productivity. It is also called as apparent
photosynthesis. Thus the difference between GPP and respiration is known as
NPP.
NPP = GPP – Respiration
NPP of whole biosphere is estimated to be about 170 billion tons
(dry weight) per year. Out of which NPP of oceanic producers is only 55 billion
tons per year in unit time.
2. Secondary productivity
The amount of energy stored in the tissues of heterotrophs or
consumers is called secondary productivity.
a. Gross secondary productivity
It is equivalent to the total amount of plant material is ingested
by the herbivores minus the materials lost as faeces.
b. Net secondary productivity
Storage of energy or biomass by consumers per unit area per unit
time, after respiratory loss is called net secondary productivity.
3. Community productivity
The rate of net synthesis of organic matter (biomass) by a group
of plants per unit area per unit time is known as community productivity.
Factors affecting primary productivity
Primary productivity depends upon the plant species of an area,
their photosynthetic capacity, availability of nutrients, solar radiation,
precipitation, soil type, topographic factors (altitude, latitude, direction),
and other environmental factors. It varies in different types of ecosystems.
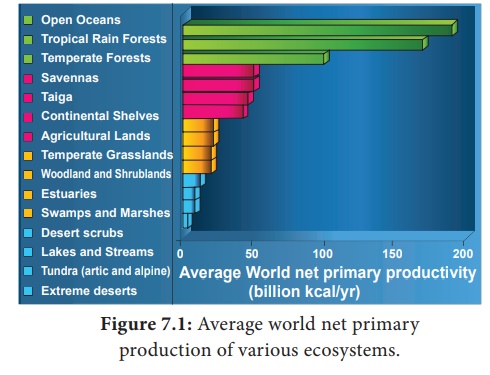
Productivity of different Ecosystems
The primary productivity of an ecosystem is not determined by size
and number of population, but by the rate of total fixation of radiant energy.
Generally, the average world net primary productivities of open
ocean and tropical rain forest are the maximum among aquatic and terrestrial
ecosystems respectively.
The following graph represents net primary productivity of various
ecosystems.
3. Concept of trophic level in an ecosystem
(Greek word ‘ trophic’ = to food or feeding)
A trophic level refers to the position of an organism in the food
chain. The number of trophic levels is equal to the number of steps in the food
chain. The green plants (producers) occupying the first trophic level (T1)
are called producers. The energy produced by the producers is utilized
by the plant eaters (herbivores) they are called primary consumers and
occupies the second trophic level (T2).
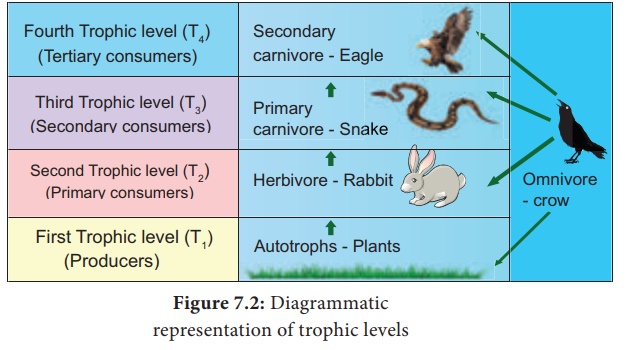
Herbivores are eaten by carnivores, which occupy the third trophic
level (T3). They are also called secondary consumers or
primary carnivores. Carnivores are eaten by the other carnivores,
which occupy the fourth trophic level (T4). They are called the tertiary
consumers or secondary carnivores. Some organisms which eat both plants
and animals are called as omnivores (Crow). Such organisms may occupy
more than one trophic level in the food chain.
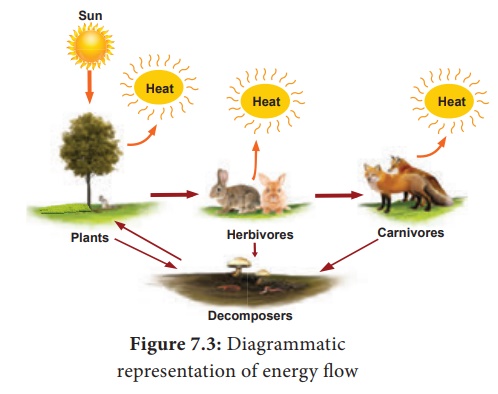
4. Energy flow
The transfer of energy in an ecosystem between trophic levels can
be termed as energy flow. It is the key function in an ecosystem. Part of the
energy obtained from the sun by producer is transferred to consumers and
decomposers through the each trophic level, while some amount of energy is
dissipated in the form of heat. Energy flow is always unidirectional in an
ecosystem.
Laws of thermodynamics
The storage and loss of energy in an ecosystem is based on two
basic laws of thermo-dynamics.
i. First law of thermodynamics
It states that energy can be transmitted from one system to
another in various forms. Energy cannot be destroyed or created. But it can be
transformed from one form to another. As a result, the quantity of energy
present in the universe is constant.
Example:
In photosynthesis, the product of starch (chemical energy) is
formed by the combination of reactants (chlorophyll, H2O, CO2).
The energy stored in starch is acquired from the external sources (light
energy) and so there is no gain or loss in total energy. Here light energy is
converted into chemical energy.

ii. Second law of thermodynamics
It states that energy transformation results in the reduction of
the free energy of the system. Usually energy transformation cannot be 100%
efficient. As energy is transferred from one organism to another in the form of
food, a portion of it is stored as energy in living tissue, whereas a large
part of energy is dissipated as heat through respiration. The transfer of
energy is irreversible natural process. Example: Ten percent law
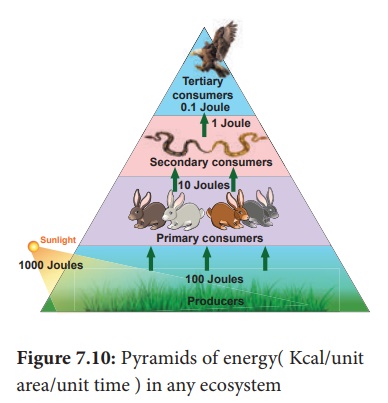
Ten percent law
This law was proposed by Lindeman (1942). It states that during
transfer of food energy from one trophic level to other, only about 10% stored
at every level and rest of them (90%) is lost in respiration, decomposition and
in the form of heat. Hence, the law is called ten percent law.
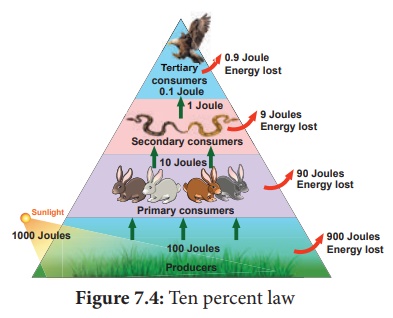
Example: It is shown that of the 1000 Joules of Solar energy trapped
by producers. 100 Joules of energy is stored as chemical energy through
photosynthesis. The remaining 900 Joules would be lost in the environment. In
the next trophic level herbivores, which feed on producers get only 10 Joules
of energy and the remaining 90 Joules is lost in the environment. Likewise, in the
next trophic level, carnivores, which eat herbivores store only 1 Joule of
energy and the remaining 9 Joules is dissipated. Finally, the carnivores are
eaten by tertiary consumers which store only 0.1 Joule of energy and the
remaining 0.9 Joule is lost in the environment. Thus, at the successive trophic
level, only ten percent energy is stored.
5. Food chain
The movement of energy from producers upto top carnivores is known
as food chain, i.e., in any food chain, energy flows from producers to
primary consumers, then from primary consumers to secondary consumers, and
finally secondary consumers to tertiary consumers. Hence, it shows linear
network links. Generally, there are two types of food chain, (1) Grazing food
chain and (2) Detritus food chain.
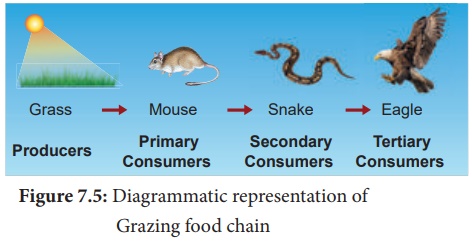
1. Grazing food chain
Main source of energy for the grazing food chain is the Sun.
It begins with the first link, producers (plants). The second link in the food
chain is primary consumers (mouse) which get their food from producers. The
third link in the food chain is secondary consumers (snake) which get their
food from primary consumers. Fourth link in the food chain is tertiary
consumers (eagle) which get their food from secondary consumers.
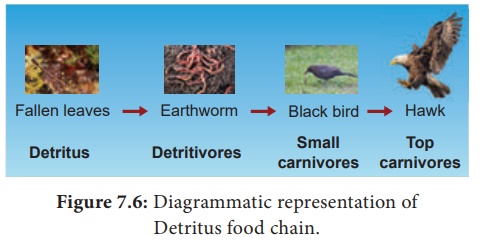
2. Detritus food chain:
This type of food chain begins with dead organic matter which
is an important source of energy. A large amount of organic matter is
derived from the dead plants, animals and their excreta. This type of food
chain is present in all ecosystems.
The transfer of energy from the dead organic matter, is
transferred through a series of organisms called detritus consumers
(detritivores)- small carnivores - large (top) carnivores with repeated eating
and being eaten respectively. This is called the detritus food chain.
6. Food Web
The inter-locking pattern of a number of food chain form a web
like arrangement called food web. It is the basic unit of an ecosystem,
to maintain its stability in nature. It is called homeostasis.
Example: In a grazing food chain of a grass land, in the absence
of a rabbit, a mouse may also eat food grains. The mouse in turn may be eaten
directly by a hawk or by a snake and the snake may be directly eaten by hawks.
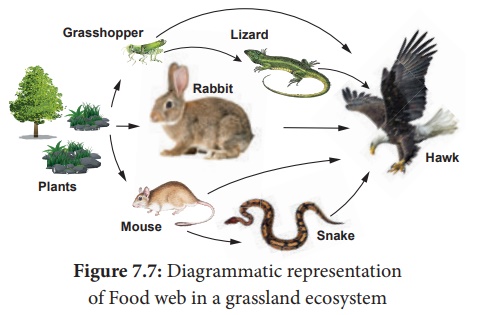
Hence, this interlocking pattern of food chains is the food web and
the species of an ecosystem may remain balanced to each other by some sort of
natural check.
Significance of food web
·
It can be used to illustrate indirect interactions among different
species.
·
It can be used to study bottom-up or top-down control of community
structure.
·
It can be used to reveal different patterns of energy transfer in
terrestrial and aquatic ecosystems.
·
Food web is constructed to describe species interaction called
direct interaction.
7. Ecological pyramids
Graphic representation of the trophic structure and function at
successive trophic levels of an ecosystem is called ecological pyramids.
The concept of ecological pyramids was introduced by Charles Elton (1927).
Thus they are also called as Eltonian pyramids.
There are three types: (1) pyramid of number (2) pyramid
of biomass (3) pyramid of energy.
1. Pyramid of number
A graphical representation of the number of organisms present at
each successive trophic level in an ecosystem is called pyramids of number.
There are three different shapes of pyramids upright, spindle and
inverted.
There is a gradual decrease in the number of organisms in each
trophic level from producers to primary consumers and then to secondary
consumers, and finally to tertiary consumers. Therefore, pyramids of number in grassland
and pond ecosystem are always upright.
In a forest ecosystem the pyramid of number is somewhat different in shape, it is because the base (T1) of the pyramid occupies large sized trees (Producer) which are lesser in number. Herbivores (T2) (Fruit eating birds, elephant, deer) occupying second trophic level, are more in number than the producers. In final trophic level (T4), tertiary consumers (lion) are lesser in number than the secondary consumer (T3) (fox and snake). Therefore, the pyramid of number in forest ecosystem looks spindle shaped.
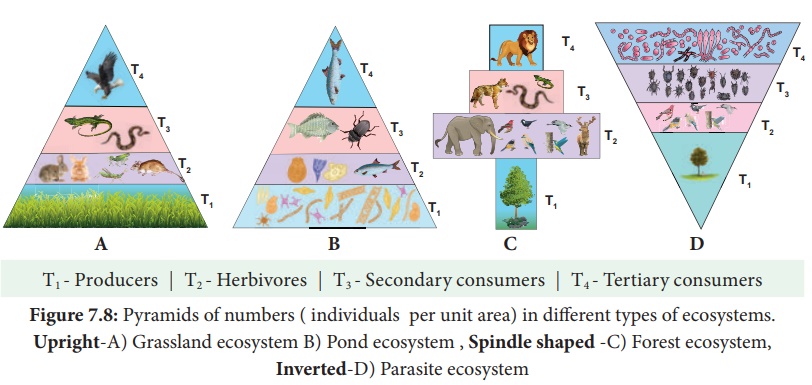
The pyramid of number in a parasite ecosystem is always inverted, because it starts with a single tree. Therefore there is gradual increase in
the number of organisms in successive tropic levels from producer to tertiary
consumers.
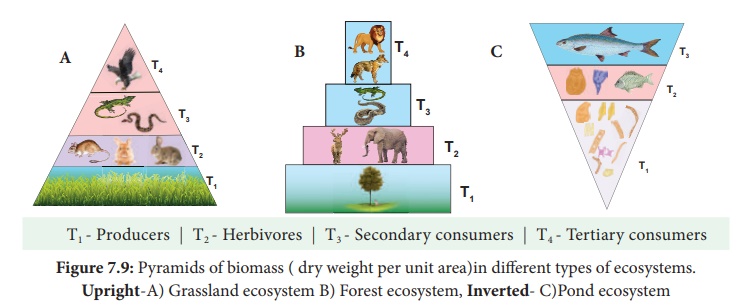
2 Pyramid of biomass
A graphical representation of the amount of organic material
(biomass) present at each successive trophic level in an ecosystem is called pyramid
of biomass.
In grassland and forest ecosystems, there is a
gradual decrease in biomass of organisms at successive trophic levels from
producers to top carnivores (Tertiary consumer). Therefore, these two
ecosystems show pyramids as upright pyramids of biomass.
However, in pond ecosystem, the bottom of the pyramid is
occupied by the producers, which comprise very small organisms possessing the
least biomass and so, the value gradually increases towards the tip of the
pyramid. Therefore, the pyramid of biomass is always inverted in shape.
3. Pyramid of energy
A graphical representation of energy flow at each successive
trophic level in an ecosystem is called pyramids of energy. The bottom
of the pyramid of energy is occupied by the producers. There is a gradual
decrease in energy transfer at successive tropic levels from producers to the
upper levels. Therefore, the pyramid of energy is always upright.
8. Decomposition:
Decomposition is a process in which the detritus (dead plants,
animals and their excreta) are breakdown in to simple organic matter by the
decomposers. It is an essential process for recycling and balancing the
nutrient pool in an ecosystem.
Nature of decomposition
The process of decomposition varies based on the nature of the
organic compounds, i.e., some of the compounds like carbohydrate, fat and
protein are decomposed rapidly than the cellulose, lignin, chitin, hair and
bone.
Mechanism of decomposition
Decomposition is a step wise process of degradation mediated by
enzymatic reactions. Detritus acts as a raw material for decomposition. It
occurs in the following steps.
a. Fragmentation - The breaking down of detritus
into smaller particles by detritivores like bacteria, fungi and earth worm is
known as fragmentation. These detritivores secrete certain substances to
enhance the fragmentation process and increase the surface area of detritus
particles.
b. Catabolism - The decomposers produce
some extracellular enzymes in their surroundings to break down complex
organic and inorganic compounds in to simpler ones. This is called catabolism
c. Leaching or Eluviation - The movement of decomposed, water soluble organic and inorganic compounds from the surface to the lower layer of soil or the carrying away of the same by water is called leaching or eluviation.
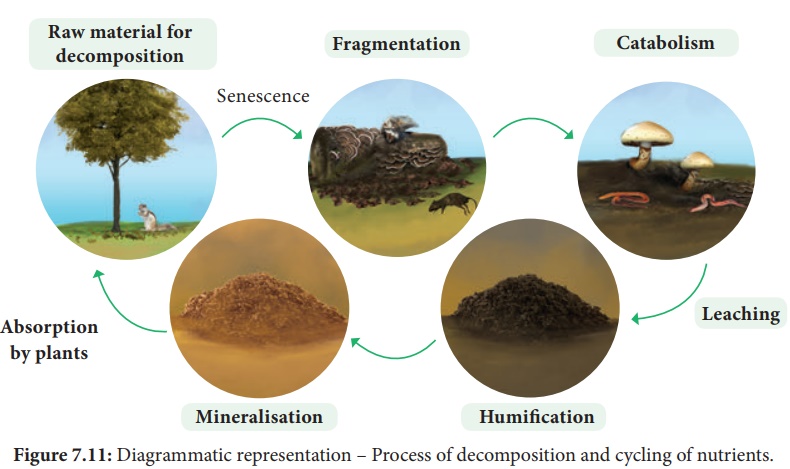
d. Humification - It is a process by which simplified detritus
is changed into dark coloured amorphous substance called humus. It is
highly resistant to microbial action, therefore decomposition is very slow. It
is the reservoir of nutrients.
e. Mineralisation - Some microbes are involved
in the release of inorganic nutrients from the humus of the
soil, such process is called mineralisation.
Factors affecting decomposition
Decomposition is affected by climatic factors like
temperature,soil moisture,soil pH ,oxygen and also the chemical quality of
detritus.
9. Biogeochemical cycle (Nutrient cycle)
Exchange of nutrients between organisms and their environment
is one of the
essential a spects of an ecosystem. All organisms require nutrients for their
growth, development, maintenance and reproduction. Circulation of nutrients
within the ecosystem or biosphere is known as biogeochemical cycles and also
called as ‘cycling of materials.’ There are two basic types,
1. Gaseous cycle – It includes
atmospheric Oxygen, Carbon and Nitrogen cycles.
2. Sedimentary cycle – It includes the cycles
of Phosphorus, Sulphur and Calcium - Which are present as sediments of
earth.
Many of the cycles mentioned above are studied by you in previous
classes. Therefore, in this chapter, only the carbon and phosphorous cycles are
explained.
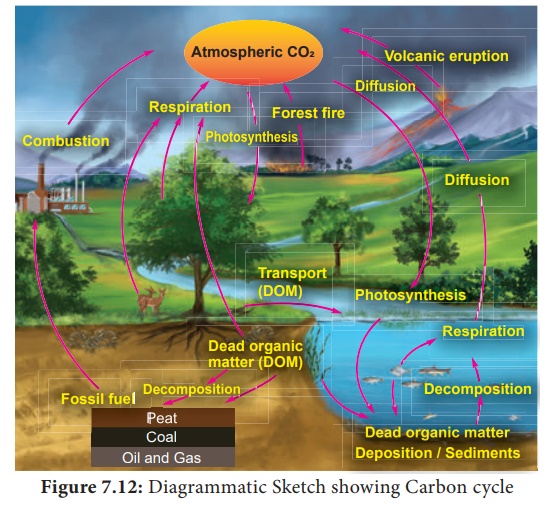
Carbon cycle
The circulation of carbon between organisms and environment is
known as the carbon cycle.Carbon is an inevitable part of all biomolecules and
is substantially impacted by the change in global climate. Cycling of carbon
between organisms and atmosphere is a consequence of two reciprocal processes
of photosynthesis and respiration.
The relesing of
carbon in the atmosphere
increases due to burning of fossile fules, deforestration, forest fire,
volcanic eruption and decomposition of dead organic matters. The details of
carbon cycle are given in the figure.
Phosphorus cycle
It is a type of sedimentary cycle. Already we know that phosphorus
is found in the biomolecules like DNA, RNA, ATP, NADP and phospholipid
molecules of living organisms. Phosphorus is not abundant in the biosphere,
whereas a bulk quantity of phosphorus is present in rock deposits, marine
sediments and guano. It is released from these deposits by weathering
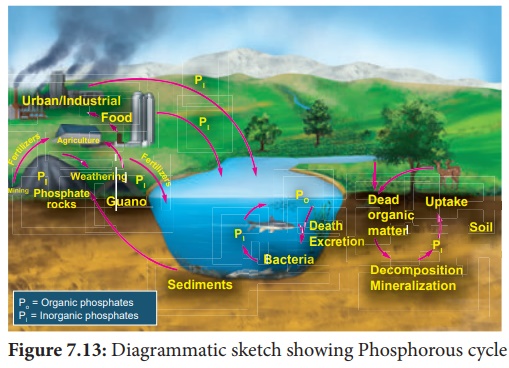
process. After that, it circulates in lithosphere as well as
hydrosphere. The producers absorb phosphorus in the form of phosphate ions, and
then it is transferred to each trophic level of food chain through food. Again
death of the organisms and degradation by the action of decomposers, the
phosphorus is released back into the lithosphere and hydrosphere to maintain
phosphorus cycle.
10. Types of ecosystem
Biosphere consists of different types of ecosystems, which are as
follows:
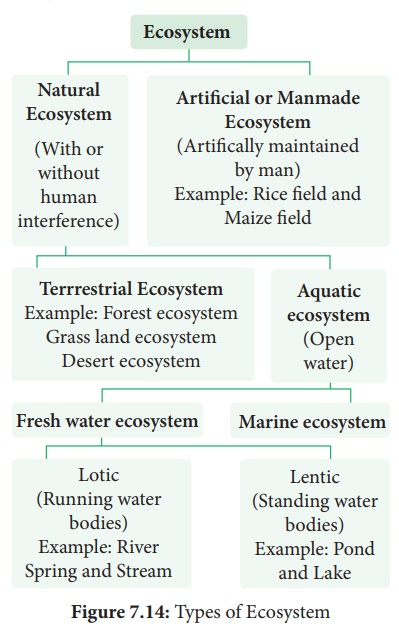
Though there are many types of ecosystems as charted above. Only
the pond ecosystem is detailed below.
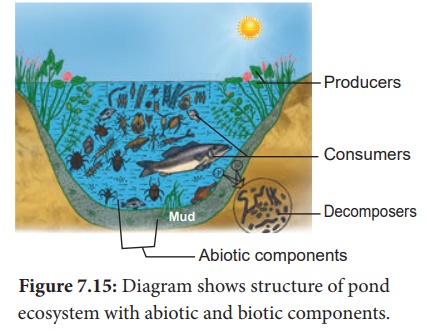
Structure of Pond ecosystem
It is a classical example for natural, aquatic, freshwater, lentic
type of ecosystem. It helps us to understand the structure and function of an
ecosystem. When rain water gathers in a shallow area, gradually over a period
of time, different kinds of organisms (microbes, plants, animals) become part
of this ecosystem. This pond ecosystem is a self sustaining and self regulatory
fresh water ecosystem, which shows a complex interaction between the abiotic
and biotic components in it.
Abiotic components
pond ecosystem consists of
dissolved inorganic (CO2, O2, Ca, N, Phosphate) and
organic substances (amino acids and humic acid) formed from the dead organic
matter. The function of pond ecosystem is regulated by few factors like the
amount of light, temperature, pH value of water and other climatic conditions.
Biotic components
They constitute the producers, variety of consumers and
decomposers (microorganisms).
a. Producers
A variety of phytoplanktons like Oscillatoria, Anabaena, Eudorina,
Volvox and Diatoms. Filamentous algae such as Ulothrix, Spirogyra, Cladophora
and Oedogonium; floating plants Azolla, Salvia, Pistia, Wolffia and Eichhornia;
sub-merged plants Potamogeton and Phragmitis; rooted floating plants Nymphaea
and Nelumbo; macrophytes like Typha and Ipomoea, constitute the major producers
of a pond ecosystem.
b. Consumers
The animals represent the consumers of a pond ecosystem include
zooplanktons like Paramoecium and Daphnia (primary consumers);
benthos (bottom living animals) like mollusces and annelids; secondary
consumers like water beetles and frogs; and tertiary consumers (carnivores) like
duck , crane and some top carnivores which include large fish, hawk ,man, etc.
c. Decomposers
They are also called as microconsumers. They help to recycle the
nutrients in the ecosystem. These are present in mud water and bottom of the
ponds. Example: Bacteria and Fungi. Decomposers perform the process of
decomposition in order to enrich the nutrients in the pond ecosystem.
The cycling of nutrients between abiotic and biotic components is
evident in the pond ecosystem, making itself self sufficient and self
regulating.
Stratification of pond ecosystem
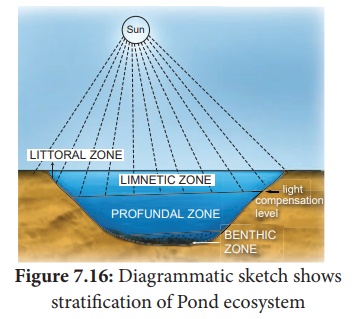
Based on the factors like distance from the shore, penetration of
light, depth of water, types of plants and animals, there may be three zones,
littoral, limnetic and profundal. The littoral zone, which is closest to the
shore with shallow water region, allows easy penetration of light. It is warm
and occupied by rooted plant species. The limnetic zone refers the open water
of the pond with an effective penetration of light and domination of planktons.
The deeper region of a pond below the limnetic zone is called profundal zone
with no effective light penetration and predominance of heterotrophs. The
bottom zone of a pond is termed benthic and is occupied by a community of
organisms called benthos (usually decomposers).The primary productivity through
photosynthesis of littoral and limnetic zone is more due to greater penetration
of light than the profundal zone.
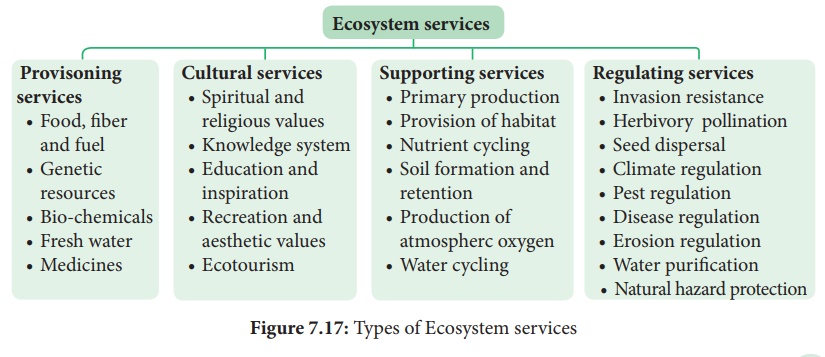
11. Ecosystem services ( Benefits)
Ecosystem services are defined as the benefits that people derive
from nature. Robert Constanza et al (1927) stated “Ecosystem services are the
benefits provided to human, through the transformation of resources (or
Environmental assets including land, water, vegetation and atmosphere) into a
flow of essential goods and services”.
Study on ecosystem services acts as an effective tool for gaining
knowledge on ecosystem benefits and their sustained use. Without such knowledge
gain, the fate of any ecosystem will be at stake and the benefits they provide to
us in future will become bleak.
Mangrove ecosystem
services
• Offers habitat and act
as nursery for aquatic plants and animals
• Providesmedicine, fuel
wood and timber.
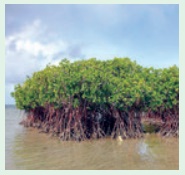
• Act as bridge between
sea and rivers by balancing sedimentation and soil erosion.
• Help to reduce water
force during cyclones, tsunamis and high tide periods.
• Help in wind break, O2
production, carbon sequestration and prevents salt spray from waves.
The varieties of benefits obtained from the ecosystem are
generally categorized into the following four types
How do anthropogenic activities affect ecosystem services?
Now, we all exploit the ecosystem more than that of our needs. The
Millennium Ecosystem Assessment (2005) found that “over the past
50 years, humans have changed the ecosystem more rapidly and extensively
than in any comparable period of time in human history, largely to meet rapidly
growing demands for food, fresh water, medicine, timber, fiber and fuel.”
Generally the following human activities disturb or re-engineer an
ecosystem every day.
·
Habitat destruction
·
Deforestation and over grazing
·
Erosion of soils
·
Introduction of non-native species
·
Over harvesting of plant material
·
Pollution of land, water and air
·
Run off pesticides, fertilizers and animal wastes
How to protect the ecosystem?
It is a practice of protecting ecosystem at individual,
organisational and governmental levels for the benefits of both nature and
humans. Threats to ecosystems are many, like adverse human activities, global
warming, pollution, etc. Hence, if we change our everyday life style, we can
help to protect the planet and its ecosystem.
“If we fail to protect environment, we will fail to save
posterity”.
Therefore, we have to practice the following in
our day today life:
·
Buy and use only ecofriendly products and recycle them.
·
Grow more trees
·
Choose sustained farm products (vegetables, fruits, greens, etc.)
·
Reduce the use of natural resources.
·
Recycle the waste and reduce the amount of waste you produce.
·
Reduce consumption of water and electricity.
·
Reduce or eliminate the use of house-hold chemicals and
pesticides.
·
Maintain your cars and vehicles properly. (In order to reduce
carbon emission)
·
Create awareness and educate about ecosystem protection among your
friends and family members and ask them to find out solution to minimise this
problem.
12. Ecosystem Management
It is a process that integrates ecological, socio economic and
institutional factors into a comprehensive strategy in order to sustain and
enhance the quality of the ecosystem to meet current and future needs.
Ecosystem management emphasis on human role in judicious use of
ecosystem and for sustained benefits through minimal human impacts on
ecosystems. Environmental degradation and biodiversity loss will result in
depletion of natural resources, ultimately affecting the existence of human
Strategy of ecosystem management
·
It is used to maintain biodiversity of ecosystems.
·
It helps in indicating the damaged ecosystem (Some species
indicate the health of the ecosystem: such species are called a flagship
species).
·
It is used to recognize the inevitability of ecosystem change and
plan accordingly.
·
It is one of the tools used for achieving sustainability of
ecosystem through sustainable development programme (or projects).
·
It is also helpful in identifying ecosystems which are in need of
rehabilitation.
·
It involves collaborative management with government agencies,
local population, communities and NGO’s.
· It is used to build the capacity of local institutions and community groups to assume responsibility for long term implementation of ecosystem management activities even after the completion of the project.
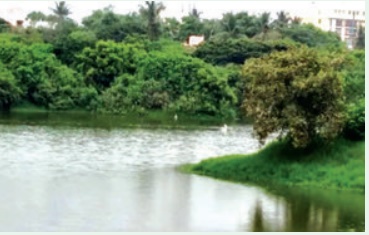
Urban ecosystem
restoration model
Adayar Poonga is located in Chennai and covers an area around a
total of 358 acres of Adayar creek and estuary, of which 58 acres were taken up
for eco restoration under the auspices of Government of Tamil Nadu. It is
maintained by Chennai Rivers Restoration Trust (CRRT).This was a dumping site
previously.
Presently it has 6 species of mangroves, about 170 species of
littoral and tropical dry evergreen forests (TDF) which have successfully
established as a sustainable ecosystem. Restoration of plants species has
brought other associated fauna such as butterflies, birds, reptiles, amphibians
and other mammals of the ecosystem.
Currently Adayar Poonga functions as an environmental education
Centre for school and college students and the public. The entire area stands
as one of the best examples for urban eco restoration in the state of Tamil
Nadu.
Related Topics