Chapter: Optical Communication and Networking : Fiber Optic Receiver and Measurements
Fiber refractive index profile measurements
Fiber refractive index profile measurements
The refractive index profile of the fiber core plays an important role in characterizing the properties of optical fibers. It allows determination of the fiber’s numerical aperture and the number of modes propagating within the fiber core, while largely defining any intermodal and/or profile dispersion caused by the fiber. Hence a detailed knowledge of the refractive index profile enables the impulse response of the fiber to be predicted.
Also, as the impulse response and consequently the information-carrying capacity of the fiber is strongly dependent on the refractive index profile, it is essential that the fiber manufacturer is able to produce particular profiles with great accuracy, especially in the case of graded index fibers (i.e. optimum profile). There is therefore a requirement for accurate measurement of the refractive index profile. These measurements may be performed using a number of different techniques each of which exhibit certain advantages and drawbacks.
In this section we will discuss some of the more popular methods which may be relatively easily interpreted theoretically, without attempting to review all the possible techniques which have been developed.
1. Interferometric methods
Interference microscopes (e.g. Mach–Zehnder, Michelson) have been widely used to determine the refractive index profiles of optical fibers. The technique usually involves the preparation of a thin slice of fiber (slab method) which has both ends accurately polished to obtain square (to the fiber axes) and optically flat surfaces. The slab is often immersed in an index-matching fluid, and the assembly is examined with an interference microscope. Two major methods are then employed, using either a transmitted light interferometer or a reflected light interferometer.
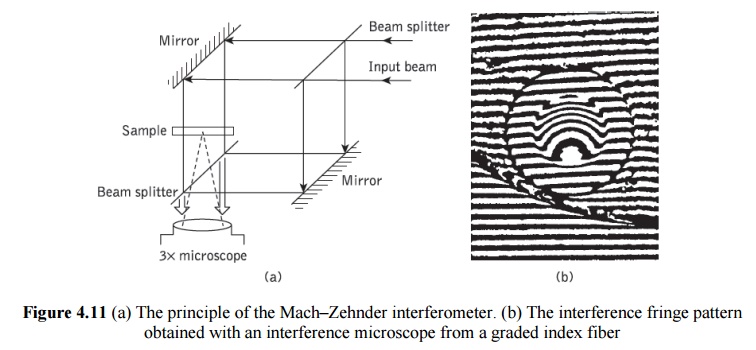
In both cases light from the microscope travels normal to the prepared fiber slice faces (parallel to the fiber axis), and differences in refractive index result in different optical path lengths. This situation is illustrated in the case of the Mach–Zehnder interferometer in Figure 4.11(a). When the phase of the incident light is compared with the phase of the emerging light, a field of parallel interference fringes is observed. A photograph of the fringe pattern may then be taken, an example of which is shown in Figure 4.11(a).
The fringe displacements for the points within the fiber core are then measured using as reference the parallel fringes outside the fiber core (in the fiber cladding). The refractive index difference between a point in the fiber core (e.g. the core axis) and the cladding can be obtained from the fringe shift q, which corresponds to a number of fringe displacements.
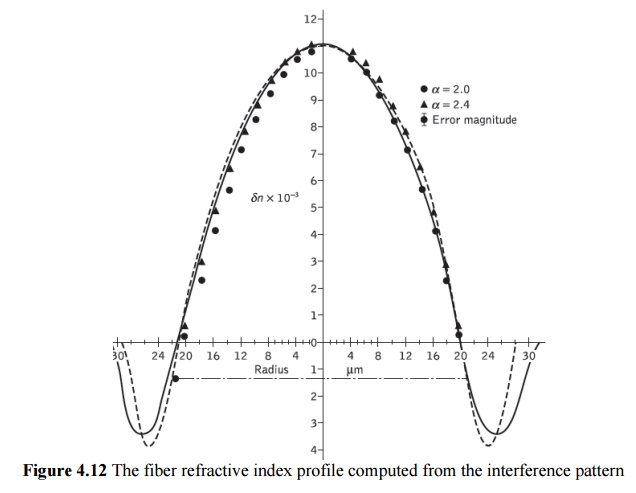
This difference in refractive index dn is given by:

where x is the thickness of the fiber slab and λ is the incident optical wavelength. The slab method gives an accurate measurement of the refractive index profile, although computation of the individual points is somewhat tedious unless an automated technique is used.
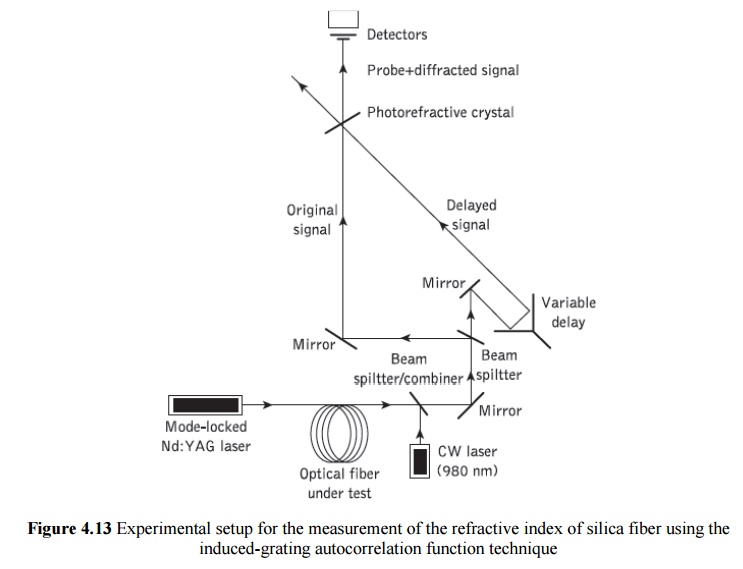
Figure 4.13 shows the experimental setup used to observe an IGA response using a nonlinear optical loop mirror interferometer. It consists of a laser source and a combination of optical lenses and mirrors where a beam splitter separates the signal creating the delayed path. The two optical signals (i.e. original and delayed signals) combine at a point where a photorefractive crystal is placed which is the mixing element employed in this method. Several crystalline material systems, known as photorefractive crystals, can be used to produce a diffraction grating in order to implement IGA. Photorefraction is, however, an electro-optic phenomenon in which the local index of refraction is modified by spatial variations of the light intensity.
2. Near-field scanning method
The near-field scanning or transmitted near-field method utilizes the close resemblance that exists between the near-field intensity distribution and the refractive index profile, for a fiber with all the guided modes equally illuminated. It provides a reasonably straightforward and rapid method for acquiring the refractive index profile.
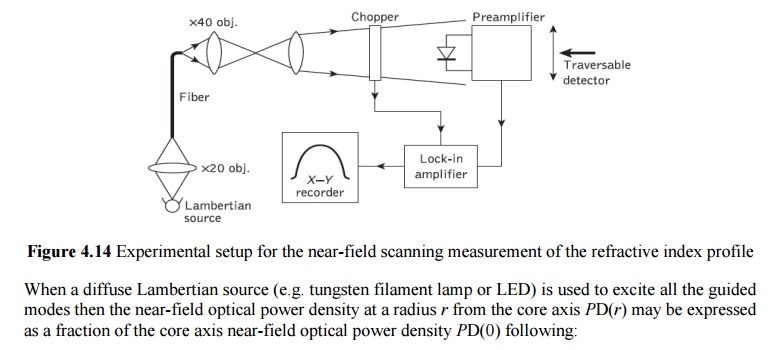
When a diffuse Lambertian source (e.g. tungsten filament lamp or LED) is used to excite all the guided modes then the near-field optical power density at a radius r from the core axis PD(r) may be expressed as a fraction of the core axis near-field optical power density PD(0) following:

where n1(0) and n1(r) are the refractive indices at the core axis and at a distance r from the core axis respectively, n2 is the cladding refractive index and C(r, z) is a correction factor. The correction factor which is incorporated to compensate for any leaky modes present in the short test fiber may be determined analytically.
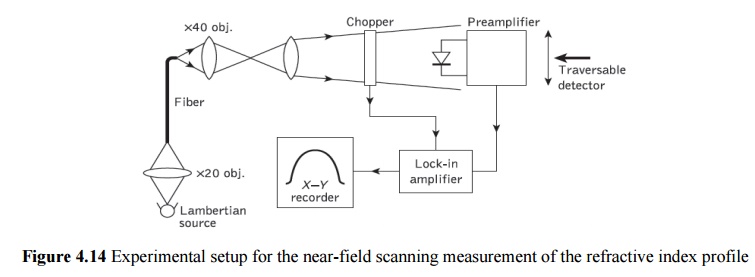
The transmitted near-field approach is, however, not similarly recommended for single-mode fiber. An experimental configuration is shown in Figure 4.14. The output from a Lambertian source is focused onto the end of the fiber using a microscope objective lens. A magnified image of the fiber output end is displayed in the plane of a small active area photodetector (e.g. silicon p–i–n photodiode). The photodetector which scans the field transversely receives amplification from the phase-sensitive combination of the optical chopper and lock-in amplifier. Hence the profile may be plotted directly on an X–Y recorder. However, the profile must be corrected with regard to C(r, z) as illustrated in Figure 4.15(a) which is very time consuming. Both the scanning and data acquisition can be automated with the inclusion of a minicomputer.
The test fiber is generally 2 m in length to eliminate any differential mode attenuation and mode coupling. A typical refractive index profile for a practical step index fiber measured by the near-field scanning method is shown in Figure 4.15(b). It may be observed that the profile dips in the center at the fiber core axis. This dip was originally thought to result from the collapse of the fiber preform before the fiber is drawn in the manufacturing process but has been shown to be due to the layer structure inherent at the deposition stage.
Related Topics