Chapter: Optical Communication and Networking : Fiber Optic Receiver and Measurements
Fiber attenuation measurements
Fiber attenuation measurements
Fiber attenuation measurement techniques have been developed in order to determine the total fiber attenuation of the relative contributions to this total from both absorption losses and scattering losses. The overall fiber attenuation is of greatest interest to the system designer, but the relative magnitude of the different loss mechanisms is important in the development and fabrication of low-loss fibers. Measurement techniques to obtain the total fiber attenuation give either the spectral loss characteristic or the loss at a single wavelength (spot measurement).
1. Total fiber attenuation
A commonly used technique for determining the total fiber attenuation per unit length is the cut-back or differential method. Figure 4.5 shows a schematic diagram of the typical experimental setup for measurement of the spectral loss to obtain the overall attenuation spectrum for the fiber. It consists of a ‘white’ light source, usually a tungsten halogen or xenon are lamp. The focused light is mechanically chopped at a low frequency of a few hundred hertz. This enables the lock-in amplifier at the receiver to perform phase-sensitive detection.
The chopped light is then fed through a monochromator which utilizes a prism or diffraction grating arrangement to select the required wavelength at which the attenuation is to be measured. Hence the light is filtered before being focused onto the fiber by means of a microscope objective lens. A beam splitter may be incorporated before the fiber to provide light for viewing optics and a reference signal used to compensate for output power fluctuations.
When the measurement is performed on multimode fibers it is very dependent on the optical launch conditions. Therefore unless the launch optics are arranged to give the steady-state mode distribution at the fiber input, or a dummy fiber is used, then a mode scrambling device is attached to the fiber within the first meter.
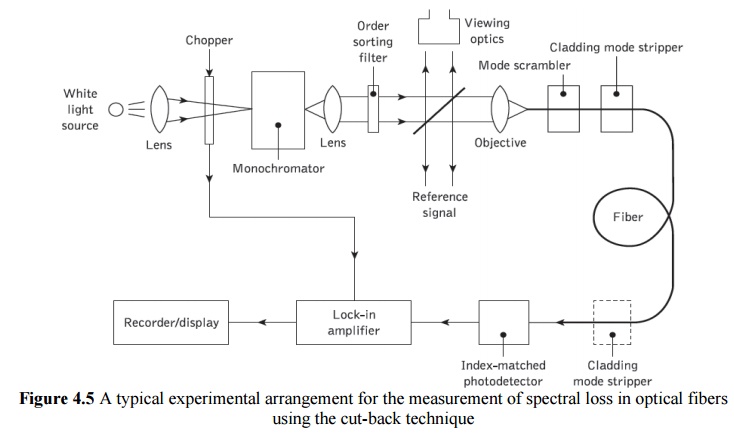
The fiber is also usually put through a cladding mode stripper, which may consist of an S-shaped groove cut in the Teflon and filled with glycerine. This device removes light launched into the fiber cladding through radiation into the index-matched (or slightly higher refractive index) glycerine. A mode stripper can also be included at the fiber output end to remove any optical power which is scattered from the core into the cladding down the fiber length. This tends to be pronounced when the fiber cladding consists of a low-refractive-index silicone resin.
The optical power at the receiving end of the fiber is detected using a p–i–n or avalanche photodiode. In order to obtain reproducible results the photodetector surface is usually index matched to the fiber output end face using epoxy resin or an index-matching gell. Finally, the electrical output from the photodetector is fed to a lock-in amplifier, the output of which is recorded.
The cut-back method* involves taking a set of optical output power measurements over the required spectrum using a long length of fiber (usually at least a kilometer). This fiber is generally uncabled having only a primary protective coating. Increased losses due to cabling do not tend to change the shape of the attenuation spectrum as they are entirely radiative, and for multimode fibers are almost wavelength independent.
The fiber is then cut back to a point 2 m from the input end and, maintaining the same launch conditions, another set of power output measurements is taken.
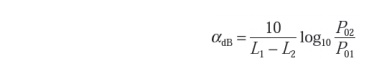
L1 and L2 are the original and cut-back fiber lengths respectively, and P01 and P02 are the correspondingoutput optical powers at a specific wavelength from the original and cut-back fiber lengths. Hence when
L1 and L2 are measuredin kilometers, αdB has units of dB km−1.

where V1 and V2 correspond to output voltage readings from the original fiber length and the cut-back fiber length respectively.
2. Fiber absorption loss measurement
It was indicated in the preceding section that there is a requirement for the optical fiber manufacturer to be able to separate the total fiber attenuation into the contributions from the major loss mechanisms. Material absorption loss measurements allow the level of impurity content within the fiber material to be checked in the manufacturing process.
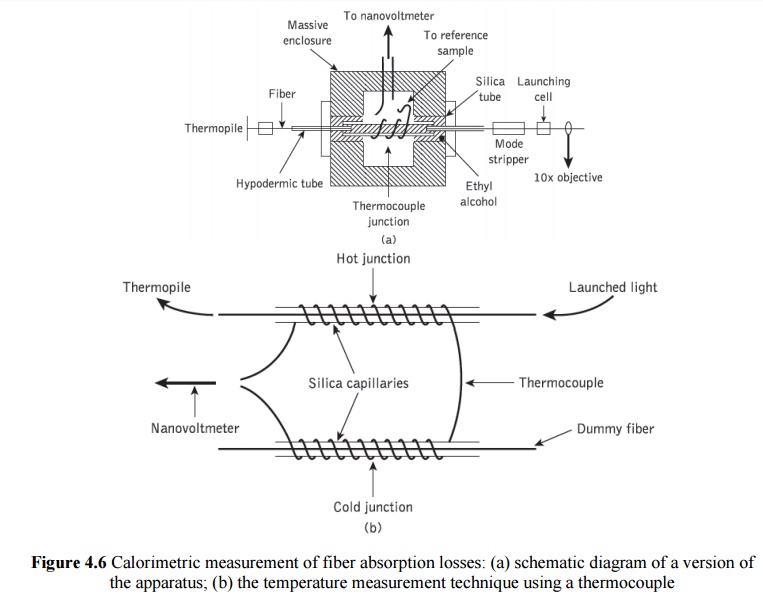
The measurements are based on calorimetric methods which determine the temperature rise in the fiber or bulk material resulting from the absorbed optical energy within the structure. The apparatus shown in Figure 4.6, which is used to measure the absorption loss in optical fibers, was modified from an earlier version which measured the absorption losses in bulk glasses. This temperature measurement technique, illustrated diagrammatically in Figure 4.6(b), has been widely adopted for absorption loss measurements.
The two fiber samples shown in Figure 4.6(b) are mounted in capillary tubes surrounded by a low-refractive-index liquid (e.g. methanol) for good electrical contact, within the same enclosure of the apparatus shown in Figure 4.6(a). A thermocouple is wound around the fiber containing capillary tubes using one of them as a reference junction (dummy fiber).
Light is launched from a laser source (Nd : YAG or krypton ion depending on the wavelength of interest) through the main fiber (not the dummy), and the temperature rise due to absorption is measured by the thermocouple and indicated on a nanovoltmeter. Electrical calibration may be achieved by replacing the optical fibers with thin resistance wires and by passing known electrical power through one. Independent measurements can then be made using the calorimetric technique and with electrical measurement instruments.
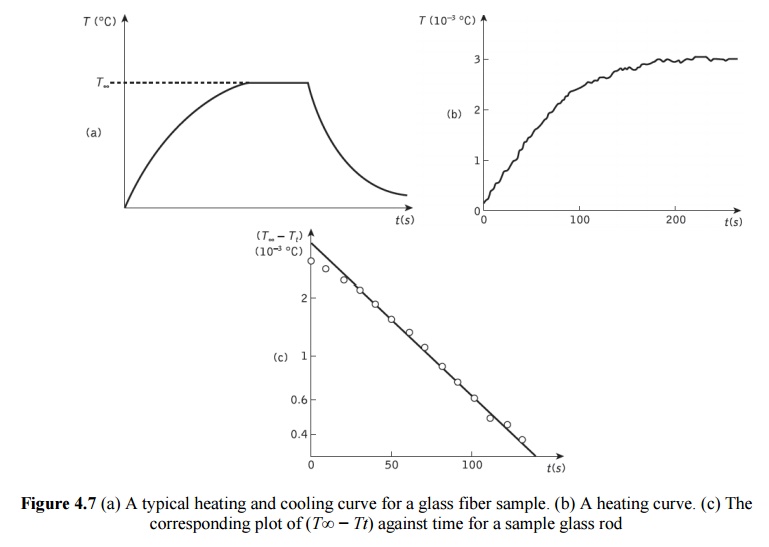
The calorimetric measurements provide the heating and cooling curve for the fiber sample used. A typical example of this curve is illustrated in Figure 4.7(a). The attenuation of the fiber due to absorption αabs may be determined from this heating and cooling characteristic. A time constant tc can be obtained from a plot of (T¥ -Tt) on a logarithmic scale against the time t, an example of which shown in Figure 4.7(c) was obtained from the heating characteristic displayed in Figure 4.7(b). T¥ corresponds to the maximum temperature rise of the fiber under test and Tt is the temperature rise at a time t.
It may be observed from Figure 4.7(a) that T¥ corresponds to a steady-state temperature for the fiber when the heat loss to the surroundings balances the heat generated in the fiber resulting from absorption at a particular optical power level. The time constant tc may be obtained from the slope of the straight line plotted in Figure 4.7(c) as:
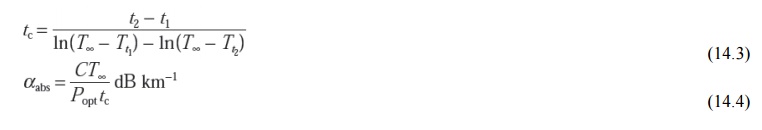
where C is proportional to the thermal capacity per unit length of the silica capillary and the low-refractive-index liquid surrounding the fiber, andPopt is the optical power propagating in the fiber under test. The thermal capacity per unit length may be calculated, or determined by the electrical calibration utilizing the thin resistance wire.
3. Fiber scattering loss measurement
The usual method of measuring the contribution of the losses due to scattering within the total fiber attenuation is to collect the light scattered from a short length of fiber and compare it with the total optical power propagating within the fiber.
Light scattered from the fiber may be detected in a scattering cell as illustrated in the experimental arrangement shown in Figure 4.8. This may consist of a cube of six square solar cells or an integrating sphere and detector. The solar cell cube which contains index-matching fluid surrounding the fiber gives measurement of the scattered light, but careful balancing of the detectors is required in order to achieve a uniform response.
This problem is overcome in the integrating sphere which again usually contains indexmatching fluid but responds uniformly to different distributions of scattered light. However, the integrating sphere does exhibit high losses from internal reflections. Other variations of the scattering cell include the internally reflecting cell and the sandwiching of the fiber between two solar cells.
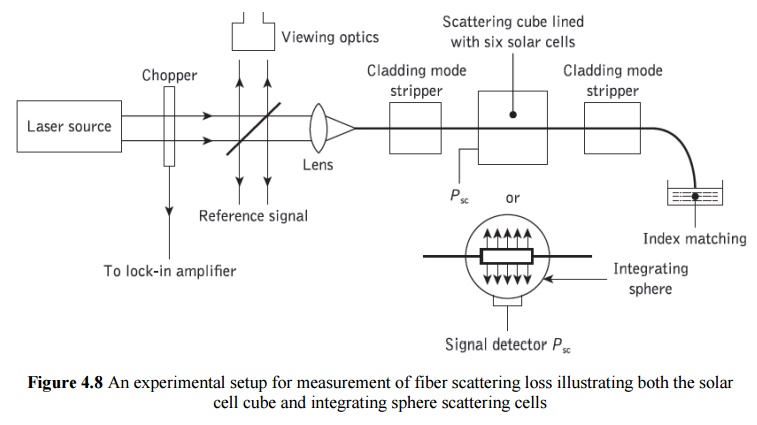
A laser source (i.e. He–Ne, Nd : YAG, krypton ion) is utilized to provide sufficient optical power at a single wavelength together with a suitable instrument to measure the response from the detector. In order to avoid inaccuracies in the measurement resulting from scattered light which may be trapped in the fiber, cladding mode strippers are placed before and after the scattering cell. These devices remove the light propagating in the cladding so that the measurements are taken only using the light guided by the fiber core. Also, to avoid reflections contributing to the optical signal within the cell, the output fiber end is index matched using either a fluid or suitable surface.
The loss due to scattering αsc is given by:

where l(km) is the length of the fiber contained within the scattering cell, Popt is the optical power propagating within the fiber at the cell and Psc is the optical power scattered from the short length of fiber l within the cell. As Popt>>Psc, then the logarithm in Eq. (4.3) may be expanded to give:

Since the measurements of length are generally in centimeters and the optical power is normally registered in volts, Eq. (4.4) can be written as:
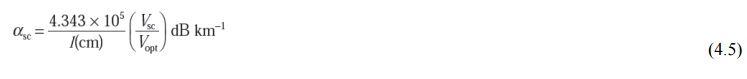
where Vsc and Vopt are the voltage readings corresponding to the scattered optical power and the total optical power within the fiber at the cell. The relative experimental accuracy (i.e. repeatability) for scatter loss measurements is in the range ±0.2 dB using the solar cell cube and around 5% with the integrating sphere. However, it must be noted that the absolute accuracy of the measurements is somewhat poorer, being dependent on the calibration of the scattering cell and the mode distribution within a multimode fiber.
Related Topics