Chapter: Communication Theory : Random Process
Correlation
CORRELATION:
In
statistics, dependence is any statistical relationship between two random
variables or two sets of data. Correlation refers to any of a broad class of
statistical relationships involving dependence. Familiar examples of dependent
phenomena include the correlation between the physical statures of parents and
their offspring, and the correlation between the demand for a product and its
price. Correlations are useful because they can indicate a predictive
relationship that can be exploited in practice. For example, an electrical
utility may produce less power on a mild day based on the correlation between
electricity demand and weather. In this example there is a causal relationship,
because extreme weather causes people to use more electricity for heating or
cooling; however, statistical dependence is not sufficient to demonstrate the
presence of such a causal relationship.
Formally,
dependence refers to any situation in which random variables do not satisfy a
mathematical condition of probabilistic independence. In loose usage,
correlation can refer to any departure of two or more random variables from
independence, but technically it refers to any of several more specialized
types of relationship between mean values. There are several correlation
coefficients, often denoted ρ or r, measuring the degree of correlation. The
most common of these is the Pearson correlation coefficient, which is sensitive
only to a linear relationship between two variables. Other correlation
coefficients have been developed to be more robust than the Pearson correlation
that is, more sensitive to nonlinear relationships. Mutual information can also
be applied to measure dependence between two variables.
ü Pearson's correlation coefficient:
He most
familiar measure of dependence between two quantities is the Pearson
product-moment correlation coefficient, or "Pearson's correlation
coefficient", commonly called simply "the correlation
coefficient". It is obtained by dividing the covariance of the two
variables by the product of their standard deviations. Karl Pearson developed
the coefficient from a similar but slightly different idea by Francis Galton.
The
population correlation coefficient ρX,Y between two random variables X and Y
with expected values μX and μY and standard deviations σX and σY is defined as:
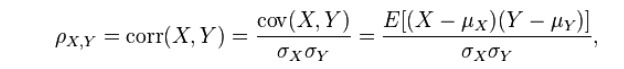
where E
is the expected value operator, cov means covariance, and, corr a widely used
alternative notation for the correlation coefficient.
The
Pearson correlation is defined only if both of the standard deviations are
finite and nonzero. It is a corollary of the Cauchy–Schwarz inequality that the
correlation cannot exceed 1 in absolute value. The correlation coefficient is
symmetric: corr(X,Y) = corr(Y,X).
The
Pearson correlation is +1 in the case of a perfect direct (increasing) linear
relationship (correlation), −1 in the case of a perfect decreasing (inverse)
linear relationship (autocorrelation),
and some value between −1 and 1 in all other cases, indicating the
degree of linear dependence between the variables. As it approaches zero there
is less of a relationship (closer to uncorrelated). The closer the coefficient
is to either −1 or 1, the stronger the correlation between the variables.
If the
variables are independent, Pearson's correlation coefficient is 0, but the
converse is not true because the correlation coefficient detects only linear
dependencies between two variables. For example, suppose the random variable X
is symmetrically distributed about zero, and Y = X2.
Then Y is
completely determined by X, so that X and Y are perfectly dependent, but their
correlation is zero; they are uncorrelated. However, in the special case when X
and Y are jointly normal, uncorrelatedness is equivalent to independence.
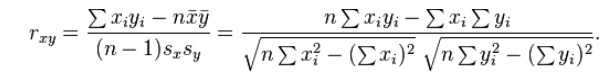
If we
have a series of n measurements of X and Y written as xi and yi where i = 1, 2,
..., n, then the sample correlation coefficient can be used to estimate the
population Pearson correlation r between X and Y.
where x
and y are the sample means of X and Y, and sx and sy are the sample standard
deviations of X and Y.
This can
also be written as:
If x and
y are results of measurements that contain measurement error, the realistic
limits on the correlation coefficient are not −1 to +1 but a smaller range.
Related Topics