Chapter: Electrical machines : Synchronous Motors
V-Curves and Inverted V-Curves
V-Curves and Inverted V-Curves
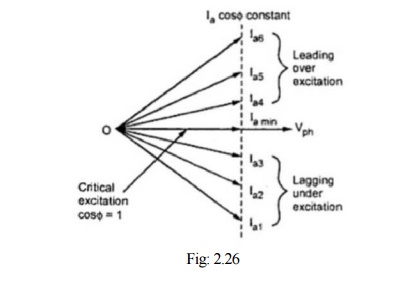
It is
clear from above discussion that if excitation is varied from very low (under
excitation) to very high (over excitation) value, then current Ia decreases,
becomes minimum at unity p.f. and then again increases. But initial lagging
current becomes unity and then becomes leading in nature. This can be shown as
in the Fig: 2.26.
Excitation
can be increased by increasing the field current passing through the field
winding of synchronous motor. If graph of armature current drawn by the motor
(Ia) against field current (If) is plotted, then its shape looks
like an english alphabet V. If such graphs are obtained at various load
conditions we get family of curves, all looking like V. Such curves are called
V-curves of synchronous motor. These are shown in the Fig: 2.27 (a).
As
against this, if the power factor (cos ф ) is plotted against field current
(If), then the shape of the graph looks like an inverted V. Such curves
obtained by plotting p.f. against If, at various load conditions are called
Inverted V-curves of synchronous motor. These curves are shown in the Fig: 2.27
(b).
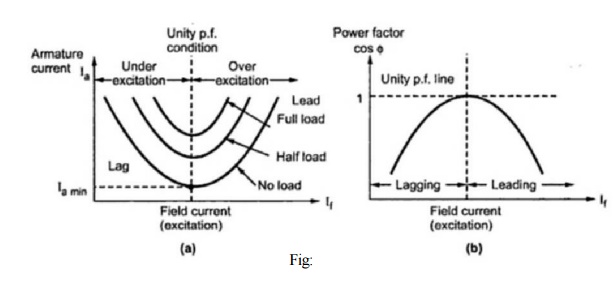
Typically,
the synchronous machine V-curves are provided by the manufacturer so that the
user can determine the resulting operation under a given set of conditions.
Related Topics