Map Reading | Chapter 8 | Geography | 8th Social Science - Types of Maps | 8th Social Science : Geography : Chapter 8 : Map Reading
Chapter: 8th Social Science : Geography : Chapter 8 : Map Reading
Types of Maps
Types of Maps
Maps are classified on several
basis. Each basis gives a different types of maps. In this lesson, we will
learn about the nature and characteristics of Relief maps, Cadastral maps and
Thematic Maps
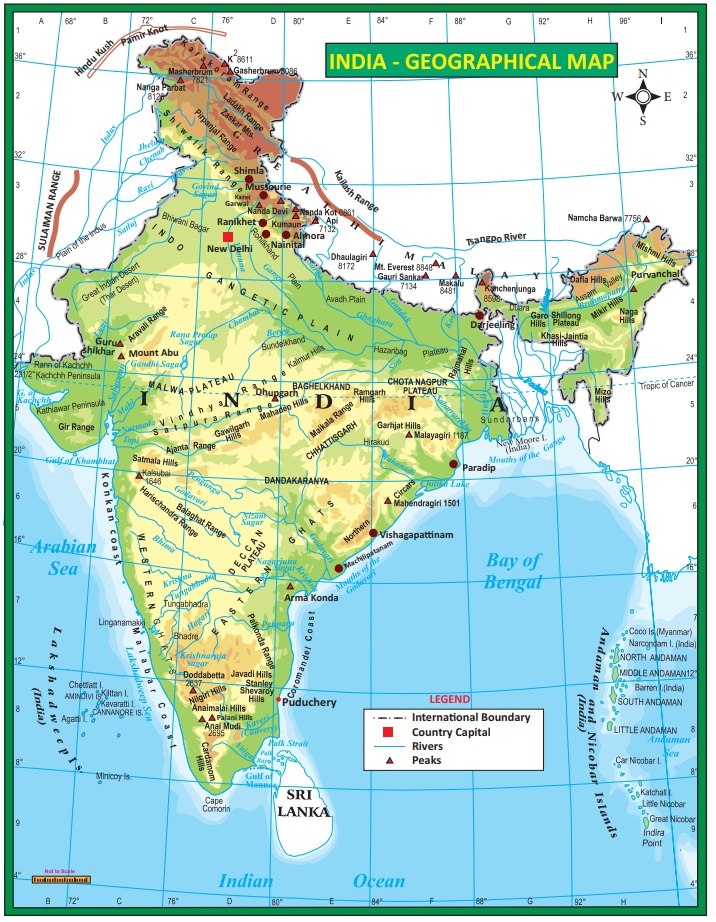
1. Relief or Physical Map
The map that shows the physical
features of an area is usually called a Physical Map or a Relief Map. Their
primary purpose is to show landforms like deserts, rivers, mountains, plains,
plateaus etc. These maps present the overall picture of the local terrain.
Different levels of altitudes and depths are also shown by these maps.
Generally the sea is coloured blue and shallow waters are shown by light blue
colours. For showing altitude, the following order is observed from low to high
light green, light brown, dark brown, crimson, red and finally white for the
high altitudinal (ice covered) places.
2. Cadastral
Map
A cadastral map refers to a map that
shows the boundaries and ownership of land within a specified area. These maps
are sometimes known as plans. As they are on large scale, they show full
details of the boundaries and buildings. They are useful for local administration
such as the city survey, taxation, management of estates and to define property
in legal documents Usually these maps are maintained by the government and they
are a matter of public record.
The term ‘Cadastral
‘is derived from the French word "Cadastre" meaning , ‘Register of
Territorial property’
Importance of Cadastral Maps
Cadastral surveys document the
boundaries of land ownership, by the production of documents, diagrams,
sketches, plans, charts and maps. They were originally used to ensure reliable
facts for land valuation and taxation.
Scale of a Cadastral Map
Cadastral maps commonly range from
scales of 1:500 to 1:10,000. Large scale diagrams or map shows more precise
dimensions and features (e.g. buildings, irrigation units, etc.) are often
prepared by cadastral surveys.
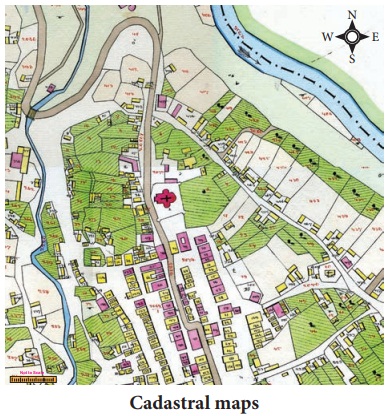
ACTIVITY: Prepare a cadastral map to show your school
building and premises with the guidance of your teacher.
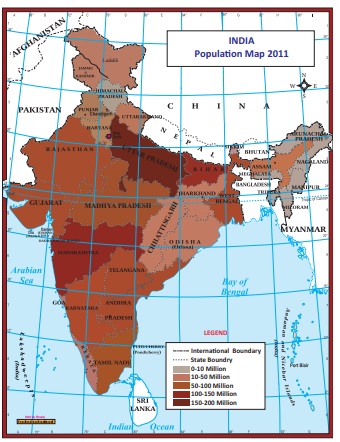
3. Thematic Map
A thematic map is a map that focuses
on a specific theme or subject area such as physical phenomena like temperature
variation, rainfall distribution and population density in an area.
Thematic maps emphasize spatial
variation of human issues like population density or prevalence of diseases.
This is in contrast to general reference maps, which just show natural features
like landforms, lines of transportation, rivers, human settlements, political
and administrative boundaries. General reference maps do not focus any specific
theme. .
Kinds of Thematic maps
Thematic maps are classified into
qualitative and quantitative thematic maps. Qualitative map is in the form of a
quality and expresses the presence or absence of the object on a map, like the
kind of vegetation present or occupying a region. Map showing the distribution
of soil types is also a qualitative map. Quantitative map expresses the
information of numerical values, like elevation in meters, temperature in
degrees Celsius etc. Choropleth map, isopleth map and dot density map are the
common types of quantitative thematic maps.
Choropleth Mapping
A choropleth map is a thematic map
in which areas are shaded or patterned in proportion to the measurement of the
statistical variable being displayed on the map, such as population density or
per-capita income
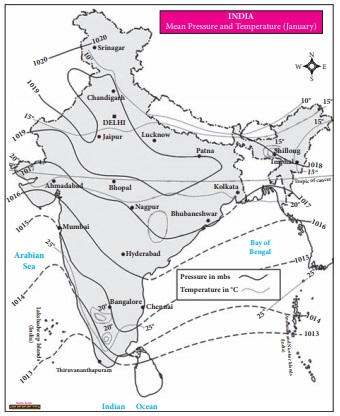
Isoline Maps
Isolines are lines drawn to link
different places that share a common value. The prefix 'iso' is a Greek word
meaning equal. So, an isoline is a line joining equal points. Isobars showing
the distribution of atmospheric pressure and isotherms showing the distribution
of temperature are the examples of isoline maps.
Dot Density Map
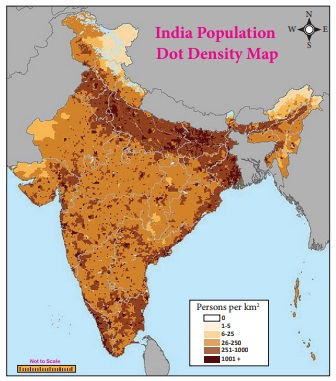
A dot-density map is a type of Thematic map that uses dots on the map to show the values of one or more numeric data fields. Each dot on a dot-density map represents some amount of data. In a dot-density map, areas with many dots indicate high concentration of values for the chosen field and fewer dots indicate lower concentrations.
Related Topics