Chapter: Civil : Engineering Economics and Cost analysis : Demand and Schedule
Types of Elasticity of Supply
ELASTICITY
OF SUPPLY
It can be defined as the degree of responsivenes of supply to a given change in price.
The
formula to find out the elasticity of supply is:
Es = percentage
change in quantity supplied / percentage change in price
TYPES OF ELASTICITY OF SUPPLY
i. Perfectly
elastic supply: Where no change in price is needed to cause an
increase in quantity supplied. This is explained with the help of a
diagram.
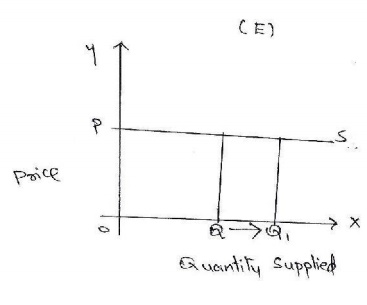
Xaxis-quantity
supplied
Yaxis-
price
SS-
supply curve
Explanation: The elasticity of supply
is infinity when a small change in price leads to an infinitelylargechangeinthequantitysupplied.Itisperfectlyelasticsupply.[E=?]
ii. Perfectly
in elastic supply: Here a large change in price causes no change in
quantity supplied. It is zero elastic supply [E=0]. This is explained
with the help of a diagram.
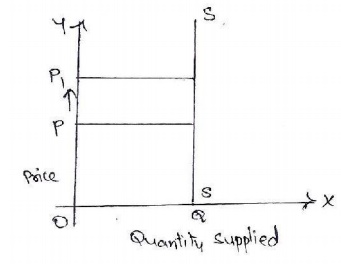
X axis-quantity
supplied
Y axis-
price
SS-
supply curve
Explanation: The figure shows that even
if the price increases from p to p1 there is no change in the quantity
supplied.
iii. Unitary
elastic: W here a given proportionate change in price causes an equally
proportionate change in quantity supplied. This is explained with the
help of a diagram.
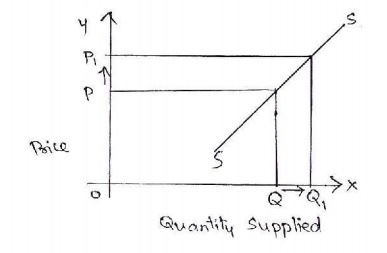
X axis-quantity
supplied
Y axis-
price
SS-
supply curve
Explanation: Elasticity of supply is
unity when the change in supply is exactly proportionate to the change
in price. [E=1].
Relatively elastic: Where a
small change in price causes a more than proportionate change in quantity
supplied. The price elasticity o f supply is greater than unity [E >1 ].This
is explained with the help of a diagram.
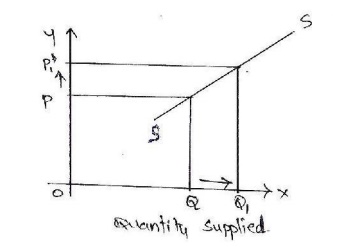
X axis-quantity
supplied
Y axis-
price
SS- supply curve
Explanation: The figure shows that
there is a small increase in price fro m P to P1, but it has resulted in
a large increase in quantity supplied from Q to Q1. It is also known as
relatively elastic supply.
v. Relatively inelastic Supply: W here a
large change in price causes a less than proportionate change in
quantity supp lied. The elasticity o f supply is lesser than unity [E <1].
This is explained with the help of a diagram.
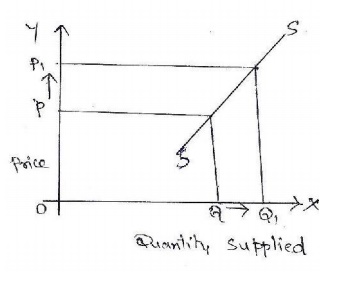
X axis-quantity
supplied
Y axis-
price
SS-
supply curve
Explanation: The figure shows that
there is a large increase in price from P to P1, but it has resulted in
only a small increase in quantity supplied from Q to Q1. It is also known as
relatively inelastic supply.
Related Topics