Chapter: Civil : Engineering Economics and Cost analysis : Demand and Schedule
Different Methods of Measuring Elasticity of Demand
DIFFERENT METHODS OF MEASURING ELASTICITY OF
DEMAND
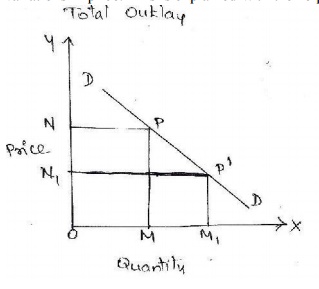
1. Total outlay: According
to this method, we compare the total outla y of the purchases or total
revenue, i.e, total value o f sales from the po int of view of the seller
before and after the variations in price. This is explained with the help of a
diagram.
X axis -------�Quantity
of X
Y axis---------�price of
X
DD ------------�demand
curve
Explanation: If the
elasticity of demand is equal to unity for all prices of the commodity only
fall in price will cause a proportionate increases in the amount bought, and
therefore will make no change in the total outla y which purchases make for the
commodity thus one is the dividing point. If the elasticity is greater than one
it is said to be elast ic and it is less than it is inelastic curve having same
elasticity throughout:-
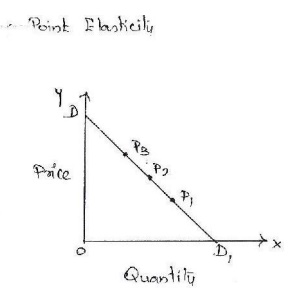
2. Point elasticity: The
concept of price elasticity can be used in comparing the sensitivity of the
different types of goods e.g., luxuries and necessaries) to changes in their
prices. The elasticity of d emand is alwa ys negative because change in
quantity demanded is in opposite direction to the change in price that is a
fall in p rice is followed b y rise in demanded and vice versa hence elasticity
less than zero.
X axis -------�Quantity
of X
Y axis---------�price of
X
DD ------------�demand
curve
Explanation:
Elasticity is represented b y
fraction distance fro m d to a point on the curve divided b y the distance from
the other end to that point. Thus elasticity of demand is seen on the points
P3, P2and P1 respectively. It is seen that elasticity at a lower point on the
curve is less than at a higher point.
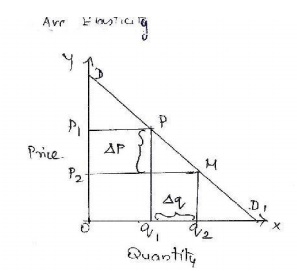
3. Arc elasticity: Arc
elasticity is a measure of the average responsiveness to price changes exhibited
by a demand curve over some finite stretch of the curve. This is explained with
the help of a diagram below.
X axis -------�Quantity
of X
Y axis---------�price of
X
DD ------------�demand curve
Explanation:-
i. Any two
points on a demand curve make an arc the area between p and m on the DD curve
is
an arc
which measures elasticity over a certain range of prices and quantities.
ii. Onanytwo
pointsofademandcurvethepriceelasticity'sofdemandarelikelytobe
different
depending upon how we calculate them.
iii. The closer thetwopoints'pandmare,themoreaccuratewilbethemeasureofelasticity. iv. The arc
elasticity is in fact the elasticity of the midpoint between p and m on the
demand
curve .
v. If there is no difference between
the two points and the y merge into each o ther o r coincide, arc
elasticity becomes point elasticity.
Related Topics