Chapter: Civil : Engineering Economics and Cost analysis : Demand and Schedule
Individual Demand Schedule and Curve and Market Demand Schedule
INDIVIDUAL DEMAND SCHEDULE AND CURVE AND MARKET
DEMAND SCHEDULE
Individual's demand
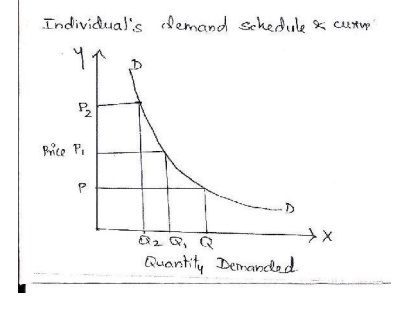
schedule and curve: Anindividual consumer's demand refers to the quantities
of a commodity demanded b y him at various prices. A demand schedule is a list
of prices and quantities and its graphic representation is a demand curve.

X axis-quantity
demanded
Y axis-
price
DD-
demand curve
Explanation:
i. The
demand schedule reveals that when the price is Rs.P2, quantity demanded is Q2
units. As the price decreases to P, the quantity demanded increases t o Q.
ii. The
individual demand curve focuses on the effects of a fall or rise in the price
of one commodityontheconsumer'sbehavior.Theyarethesubstation
and income effects.
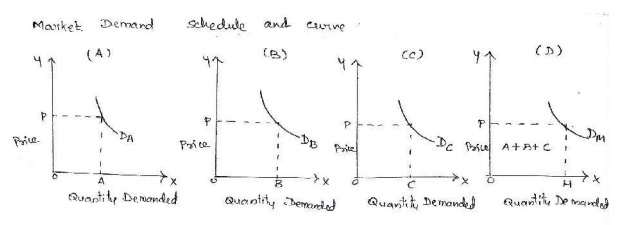
Market demand schedule and curve: In a
market, there is not one consumer but many consumers of a commodity. The
market demand of a commodity is depicted on a demand schedule and demand curve.
The y show the sum total of various quantities demanded by all the individuals
at various prices. S uppose there are three individuals A, B and C in a market
who purchase the commodity. The demand schedule for the commodity is depicted
in table below.

X axis-quantity
demanded
Y axis-
price
DD-
demand curve
Explanation:
i. Suppose
there are three individuals A,B and C in a market who buy OA,OB and OC
quantities of the commodity at the price OP, as shown in panels (A),(B) and (C)
respectively.
ii. In the market OQ quantity will be
bought which is made up by adding together the quantities OA,OB and OC.
iii. The
market demand curve DM is obtained by the lateral summation of the
individual demand curves DA, DB and Dc
Related Topics