Chapter: Civil : Engineering Economics and Cost analysis : Demand and Schedule
Different Types of Cross Elasticity of Demand
DIFFERENT
TYPES OF CROSS ELASTICITY OF DEMAND
A. CROSS ELASTICITY OF SUBSTITUTES : In case
of substitutes, as the price of one good increases the demand for the
other good also increase at the same time.
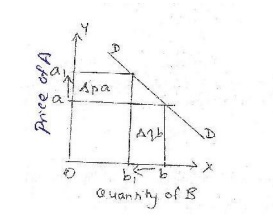
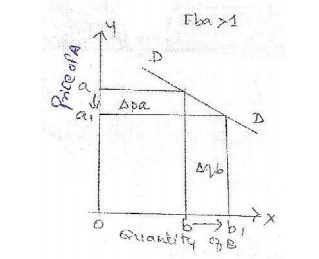
i.Relatively elastic: Where a
small change in price of good A causes a large change in quantity demanded
of good B. The elasticity o f substitutes is greater than unity [E >1].This
is explained with the help of a diagram.
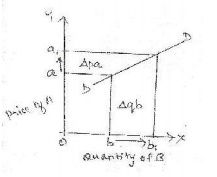
X axis -quantity
demanded of B
Y axis -price of
A
DD -demand
curve
Explanation: The figure shows that
there is a small increase in price of good A from a to a1, but it has
resulted in a large increase in quantity demanded of B from b to b1. It is also
known as relatively elastic demand.
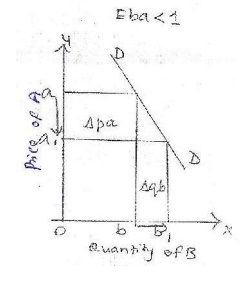
ii. Relatively inelastic demand: W here a
large change in price of good A causes a small change in quantity
demanded of good B. The elasticity of substitutes is lesser than unity [E
<1]. This is explained with the help of a diagram.
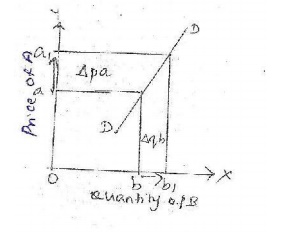
X axis -quantity
demanded of good B
Y axis -price of
good A
DD-
demand curve
Explanation: The figure shows that
there is a large increase in price o f good A from a to a1, but it has
resulted in only a small increase in quantity demanded of good B from b to b1.
It is also known as relatively in elastic demand.
iii.Unitary elastic: Here a
given proportionate change in price causes an equally proportionate change
in quantity demand. This is explained with the help of a diagram.
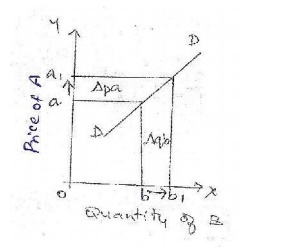
X
axis-quantity demanded of good B
Y axis-
price of good A
DD-
demand curve
Explanation: Price elasticity of demand
is unity when the change in demand is exactly proportionate to the
change in price. [E=1].
iv.Perfectly in elastic demand: Here a
large change in price causes no change in quantity demanded. It is zero
elastic de mand [E=0]. This is explained with the help of a diagram.
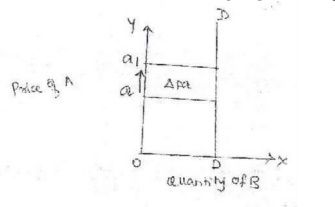
X
axis-quantity demanded of good B.
Y axis-
price of good A.
DD-
demand curve
Explanation: The figure sho ws that
even if the price increases from a to a1 there is no change in the
quantity demand . This happens in case of necessities like salt .
v. Unrelated
goods: If two goods are not at all related then they have negative
elasticity of demand. This is explained wit h the help of a diagram.
X axis -quantity
demanded of good B.
Y axis -Price of
good A.
DD-
demand curve
Explanation: The figure shows that in
case on unrelated goods if the price of good A increase from a to a1,
then the demand for good B will decrease from b to b1.
B. CROSS ELASTICITY OF COMPLIMENTARY GOODS: In case
of complimentary goods, as the price of o ne good increases the demand
for the other good decreases at the same time.
i.Perfectly elas tic demand: W here no
reductio n in price is needed to cause an increase in quantity demanded.
This is explained with the help of a diagram.
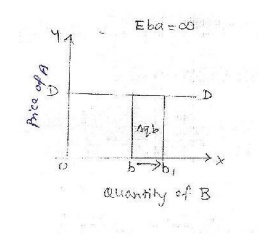
X
axis-quantity demanded of good B
Y axis-
price of good A
DD-
demand curve
Explanation: Price elasticity o f
demand is infinity when a small change or no change in price of good A
leads to an infinitely large change in the amount demanded of good B. It is perfectly elastic demand. [E=?]
ii. Perfectly in elastic demand: Here a
large change in price of good B causes no c hange in quantity demanded o
f good B. It is zero elastic demand [E=0]. This is explained with the help of a
diagram.
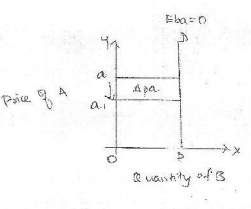
X axis-quantity
demanded of good B
Y axis-
price of good A
DD-
demand curve
Explanation: The figure shows that even
if the price of good B decreases from a to a1 there is no change in the
quantity demand of good A. This happens in case of necessities like salt.
iii.Unitary elastic: W here a
given proportionate change in price causes an equally proportionate change
in quantity demand. This is explained with the help of a diagram.
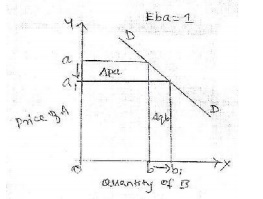
X
axis-quantity demanded of good B
Y axis-
price of good A
DD- demand
curve
Explanation: Price elasticity of demand
is unity when the change in demand is exactly proportionate to the
change in price. [E=1].
iv. Relative
ly elastic: Where a small change in price of good B causes a
more than proportionate change in quantity demanded of good A. The price
elasticity of demand is greater than unity [E >1].This is explained with the
help of a diagram.
X axis -quantity demanded of good
B
Y axis -price of good A
DD -demand curve
Explanation: The
figure shows that there is a small decrease in price fro m a to a1, but it has
resulted in a large increase in quantity demanded from b to b1. It is also
known as relatively elastic demand.
v. Relatively inelastic
demand: W here a change in price causes a less than proportionate change
in quantity d emanded. The price elasticity of demand is lesser than unity [E
<1]. This is explained with the help of a diagram.
X axis -quantity demanded of good
B
Y axis -price of good A
DD- demand curve
Explanation: The figure shows that
there is a large decrease in price fro m a to a1, but it has resulted in
only a small increase in quantity demanded from b to b1. It is also known as
relatively elastic demand.
Related Topics