Chapter: Aquaculture Engineering : Internal Transport and Size Grading
The importance of fish handling
The importance of fish handling
Why move the fish?
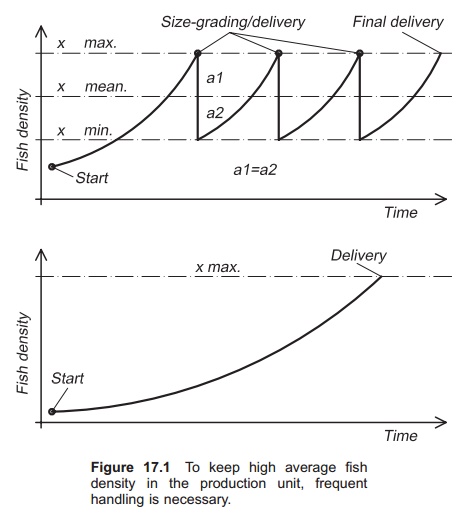
The amount of fish or shellfish that can be produced on a farm depends on the fish density in the production units. Land-based fish farms equipped for intensive farming require high investment per unit farming volume. Continuous high fish density is therefore necessary to attain good production economy; this will require frequent transport or reallocation of fish as they grow (Fig. 17.1).
How often the fish must be moved is mainly decided by their growth rate, but input density and maximum allowed density in the production units
Example
On a farm for ongrowing fish, the fish will not be moved during production (from input to delivery). Average stocking density is set at 45 kg/m3, and the maximum density to avoid growth reduction is set at 100 kg/m3. Calculations show that the input density cannot therefore exceed 2 kg/m3 (determined by exponential growth in kg/m3). This shows that poor utilization of the production units will result if the fish are not moved. The length of production depends on input size, harvesting size and specific growth rate (SGR) in relation to fish size (daily growth rate expressed as percentage of body weight).
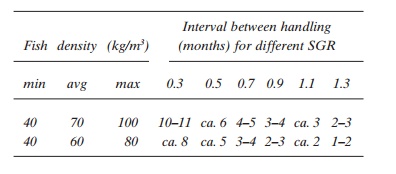
If higher average density is to be achieved, frequent moving of the fish is necessary, as illustrated by the following example. Maximum density must not exceed 100 kg/m3, and required average fish density in the production units on the farm is 70 kg/m3. The SGR is set at 0.9. The intervals between the movements for dividing/splitting of the fish group are calculated to be 3–4 months. The table illustrates the interval between handling (months) in relation to SGR, input density, average density and maximum density where the input weight of the fish is 100 g and the harvesting weight 4 kg. This clearly shows that increased growth rate increases the need for handling.
Why size grade?
In a fish group there are several reason for size grading of fish.
Improved growth
In a large group of fish in tanks or cages, there is individual variation in the growth rate. Some individuals grow faster than others so differences in the individual weights for the fish in the group will develop over a period of time, even if all the fish in the group have exactly the same weight when the feeding period starts. This is a sub-optimal situation for several reasons.
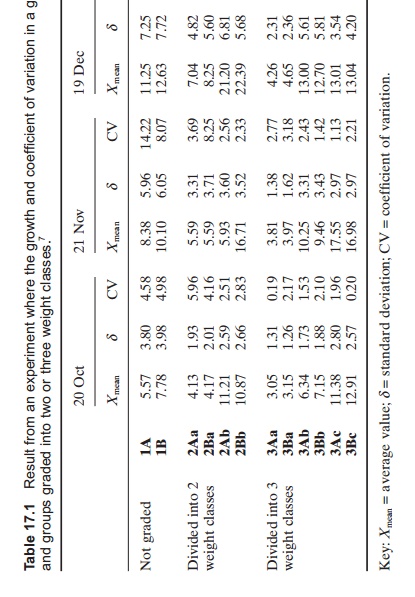
An ordinary biological population will typically have a normal (Gaussian) distribution of weight resulting from genetic variation in growth rate. Under farming conditions with artificial feeding, this normal distribution may develop to form a hierarchy preventing smaller, less dominant individuals gaining access to feed. Because of this, the variation in size might become so large, the bigger fish will eat the smaller ones. How fast cannibalism develops in the population is species dependent. For instance, cannibalism will develop very rapidly if bass are not graded.5 The distribution in the fish group may develop from normal distribution to a two group distribution, with typical winners and losers; this may reduce the total growth in a fish group (Table 17.1).
The coefficient of variation (CV) can be used to describe the weight variation in the fish group. The CV is the standard deviation (d) expressed as a per-centage of the mean value
CV = (δ/Xmean) × 100.
If the mean weight of fish in group is 2 kg and the standard deviation is 0.5 kg, the CV will be (0.5/2) × 100 = 25%. In a fish group the CV varies with species, size, age and farming conditions. The CV in a fish group is related to the growth rate; faster development occurs with faster growth. For example, in salmon smolt production the CV can be up to 100%, while in on-growing production in sea-water the CV is seldom above 30%.
When size grading a fish group into several weight groups, the individual weight variation in each of the new groups will be less than in the start-ing group. When dividing a fish group into two, fish smaller than the mean size are put in one group and those that are larger in the other. When grading into three or four groups, the size variation in each group is of coarse even less. On a typical salmon smolt farm between three and five gradings per year are normal.8,9 For on-growing in cages, one grading is normally enough plus a possible grading in connection with harvesting.
Production control
To ensure good production control in an intensive drifted farm, it is necessary to maintain a small size variation, i.e. a low CV.10 Production must be con-trolled to maintain a satisfactory growth rate on the farm in relation to budget. This requires regular weight sampling to ascertain average fish size in the group. In a tank or cage with tens of thousands of fish it is impossible to weigh all the fish individually, so only a sample of the fish is withdrawn for weight sampling; this sample must be representative of the whole group. However, this is difficult, espe-cially if there is a large size variation in the group. Several methods, including the use of monitoring instruments, can be used for this purpose.
One manual method of weight sampling uses a dip net to take fish from a group, for instance, from a tank of juvenile fish.Three samples of at least 50 fish each are taken out from the total fish group in the production unit using the dip net. A require-ment of this method is that the CV of the three samples shall vary by less than 2%, otherwise more samples are needed. Below an example is used to illustrate how this functions in a population with some size variation.
Example
Three samples taken from a large fish group in a tank of juvenile fish give the following results:
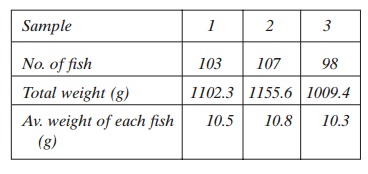
The average fish weight based on the average of the three samples is 10.53 g. To simplify the calculations an equal number of fish between the samples is assumed. Between the three samples the standard deviation (d) is 0.252. This gives a (coefficient of variation) (CV) of:
(0.252/10.53) x 100 = 2.39%
This does not fulfil our requirements for a CV below 2% and another sample needs to be taken.
Sample 4: 102 fish of total weight 1071.0 g, so average weight of each fish 10.50 g.
New average weight = 10.525 g new standard deviation (δ) = 0.206; new CV = 1.96%. This is satisfactory, below 2%.
This shows the difficulties of taking representative weight samples from a fish group. It is not normally possible to obtain an acceptable (CV) without size grading the fish.
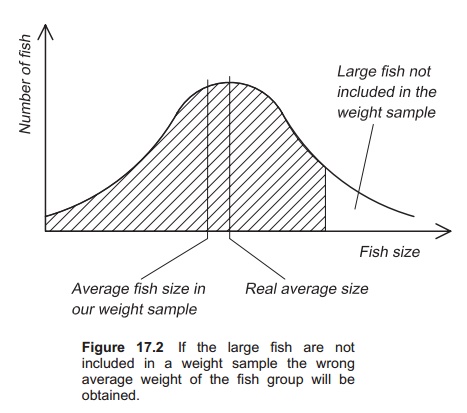
Manual weight samples also include other sources for mistakes. Before taking out the fish for sampling it is important to mix them. Experience in tanks has shown that there is a tendency for the largest fish to be near the bottom; in cages the largest fish are always in the deepest layers when fish are collected for weight sampling (Fig. 17.2). Further, all the fish that have been withdrawn in the sample in the dip net must be weighed, not just the first individuals that are removed (see example below). If the fish are small it is quite easy to get far more than 50 fish in the dip net.
Example
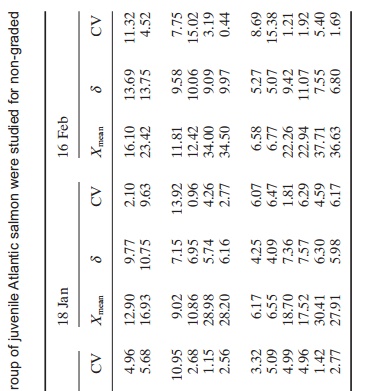
Below the results from the author’s experiment where the weight (g) of different fish withdrawn from a fish group collected in a deep net are shown.
The results are given for the first 10 fish, the middle 10 fish and the last 10 fish withdrawn from a sample of 50 fish, for an ungraded and a graded fish group.
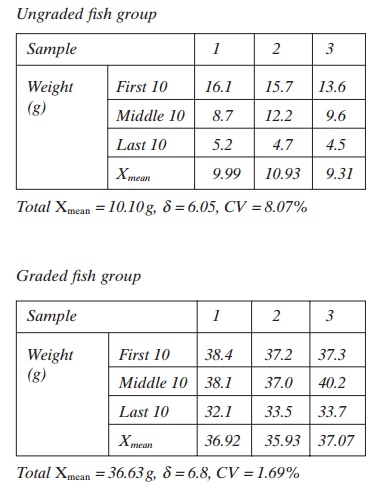
These results show the largest fish are withdrawn first and the smallest at the end.
Harvesting of fish
When a pond, tank or cage is to be harvested, it is a great advantage if the fish in it have been size graded. If not, the slaughterhouse must deal with several sizes of fish which must go to the consumer in different weight classes. It is also more difficult to estimate precisely the amount of fish in each weight class and therefore to achieve a good price. An example is given below where the fish are ungraded (adapted from ref.10). Another solution is to size grade in connection with harvesting and send the fish that are too small back to the production unit.
Example
A fish population with 10 000 fish (n) is to be har-vested. The average fish size (x) is 4 kg and the standard deviation (d) is measured as 1 kg giving a coefficient of variation (CV) of 25%. Find the number of the different weight classes represented, and the assumed number in each weight class of 1 kg if the fish group distribution is normal.
In this case a normal distribution table can be used, from which the value of δ is found to be 0.841. This means that 84.1% of the fish have a weight less than x +δ (5 kg). 15.9% of the fish in the group must therefore be larger than this, so of the 10 000 fish, 1590 are over 5 kg.
Similarly the number of fish under x − δ = 4 − 1 = 3 kg can be calculated and is 1590. Therefore between 3 and 5 kg there are 10 000 − (1590 + 1590) = 6820 fish. These are equally divided between 3–4 kg and 4–5 kg weight classes, each of which comprise 3410 fish.
Next the numbers of fish larger than 6 kg and smaller than 2 kg are calculated; this represents x + 2 δ. Again the normal distribution table is used and 2δ = 2 gives the value 0.977, meaning that 97.7% of the fish are smaller than 6 kg and larger than 2 kg, so 2.3% are larger than 6 kg and 2.3% smaller than 2 kg. 2.3% of 10 000 = 230 fish. Therefore there are 1360 fish between 2 and 3 kg and also between 5 and 6 kg. The numbers of fish below 1 kg and over 7 kg are very low (13 fish in each case) and can be ignored.
As this shows, there are six different weight classes that have to be sent to the slaughterhouse. This makes management quite difficult.
Related Topics