Chapter: Satellite Communication : Earth Segment
Test Equipment Measurements on G/T, C/No, EIRP
Test Equipment
Measurements on G/T, C/No, EIRP:
Measurement
of G/T of small antennas is easily and simply measured using the spectrum
analyser method. For antennas with a diameter of less than 4.5 meters it is not
normally necessary to point off from the satellite.
A
step in frequency would be required into one of the satellite transponder guard
bands.
However
antennas with a G/T sufficiently large to enable the station to see the
transponder noise floor either a step in frequency into one of the satellite transponder
guard bands and/or in azimuth movement would be required.
The
test signal can be provided from an SES WORLD SKIES beacon.
Procedure
:
(a)
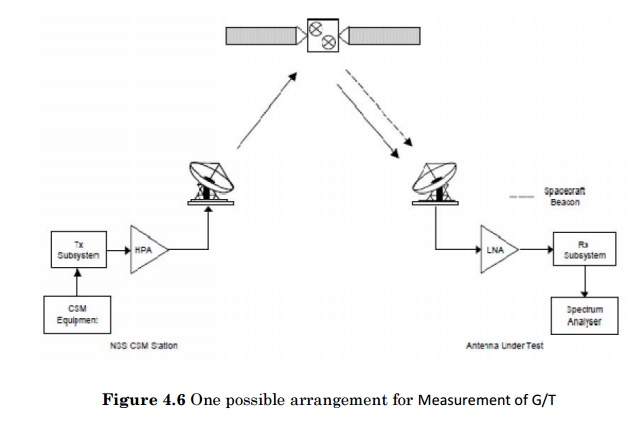
Set up the test equipment as shown below. Allow half an hour to warm up, and
then calibrate in accordance with the manufacturer’s procedures.
(b)
Adjust the centre frequency of your spectrum analyzer to receive the SES WORLD
SKIES beacon (data to be provided on the satellite used for testing)
(c)
Carefully peak the antenna pointing and adjust the polarizer by nulling the
cross polarized signal. You cannot adjust polarization when using the
circularly polarized SES WORLD SKIES beacon.
(d)
Configure the spectrum analyser as follows:
Centre
Frequency: Adjust for beacon or test signal frequency (to be advised).
Use
marker to peak and marker to centre functions.
Frequency Span: 100 KHz
Resolution Bandwidth: 1 KHz
Video Bandwidth: 10 Hz (or sufficiently small to limit noise variance)
Scale: 5 dB/div
Sweep Time: Automatic
Attenuator Adjust to ensure linear operation. Adjust to provide the "Noise
floor delta" described in steps 7 and 8.
(e)
To insure the best measurement accuracy during the following steps, adjust the
spectrum analyser amplitude (reference level) so that the measured signal,
carrier or noise, is approximately one division below the top line of the
spectrum analyser display.
(f)
Record the frequency and frequency offset of the test signal from the nominal
frequency:
For
example, assume the nominal test frequency is 11750 MHz but the spectrum
analyser shows the peak at 11749 MHz. The frequency offset in this case is -1
MHz.
(g)
Change the spectrum analyser centre frequency as specified by SES WORLD SKIES
so that the measurement is performed in a transponder guard band so that only
system noise power of the earth station and no satellite signals are received.
Set the spectrum analyser frequency as follows:
Centre
Frequency = Noise slot frequency provided by the PMOC
(h)
Disconnect the input cable to the spectrum analyser and confirm that the noise
floor drops by at least 15 dB but no more than 25dB. This confirms that the
spectrum analyser’s noise contribution has an insignificant effect on the
measurement. An input attenuation value allowing a "Noise floor
Delta" in excess of 25 dB may cause overloading of the spectrum analyser input.
(i)
Reconnect the input cable to the spectrum analyser.
(j)
Activate the display line on the spectrum analyser.
(k)
Carefully adjust the display line to the noise level shown on the spectrum
analyser. Record the display line level.
(l)
Adjust the spectrum analyser centre frequency to the test carrier frequency
recorded in step (e).
(m)
Carefully adjust the display line to the peak level of the test carrier on the
spectrum analyser. Record the display line level.
(n)
Determine the difference in reference levels between steps (l) and (j) which is
the (C+N)/N.
(o)
Change the (C+N)/N to C/N by the following conversion:
This
step is not necessary if the (C+N)/N ratio is more than 20 dB because the
resulting correction is less than 0.1 dB.

(p)
Calculate the carrier to noise power density ratio (C/No) using:

The
2.5 dB figure corrects the noise power value measured by the log converters in
the spectrum analyser to a true RMS power level, and the SAcorr
factor takes into account the actual resolution filter bandwidth.
(q)
Calculate the G/T using the following:
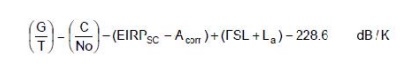
where,
EIRPSC
– Downlink EIRP measured by the PMOC (dBW)
Acorr
– Aspect correction supplied by the PMOC (dB)
FSL
– Free Space Loss to the AUT supplied by the PMOC (dB)
La
– Atmospheric attenuation supplied by the PMOC (dB)
(r)
Repeat the measurement several times to check consistency of the result.
Related Topics