Force and Motion | Term 1 Unit 2 | 7th Science - Speed – time graphs | 7th Science : Term 1 Unit 2 : Force and Motion
Chapter: 7th Science : Term 1 Unit 2 : Force and Motion
Speed – time graphs
Speed – time graphs
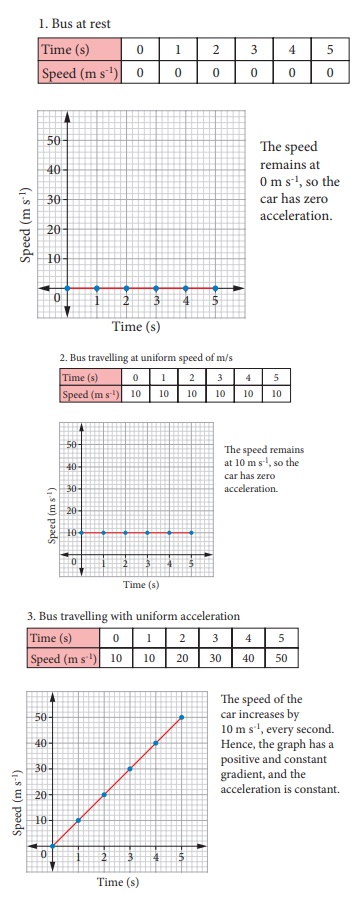
Let us consider a bus travelling
from Thanjavur to Trichy. The speed of the bus is measured for every second.
The speed and time are recordedand a graph is plotted using the data. The
results for four possible journeys are shown.
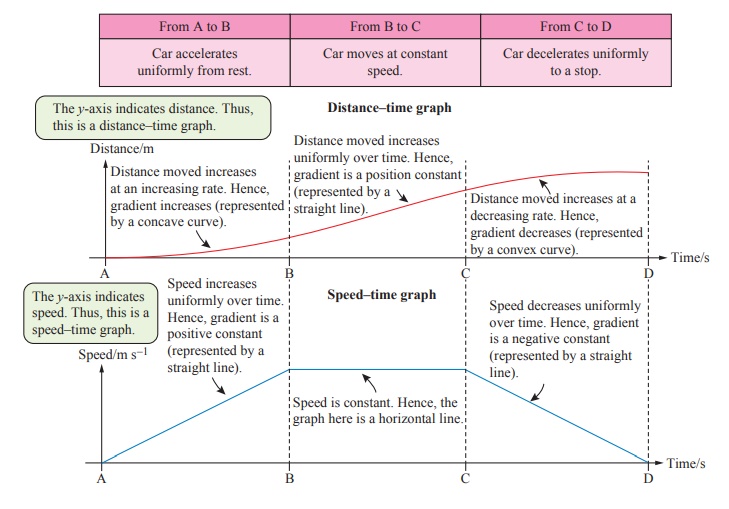
Comparisons between
distance – time and speed – time graphs
Speed – time graphs
and Distance – time graphs
look very similar, but they give different information. We
can differentiate them by looking at the labels.
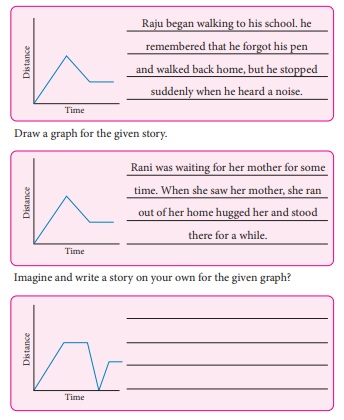
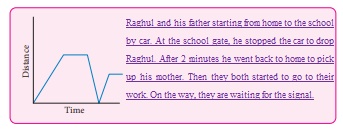
Raghul and his father starting from home to the school by car.
At the school gate, he stopped the car to drop Raghul. After 2 minutes he went
back to home to pick up his mother. Then they both started to go to their work.
On the way, they are waiting for the signal.
Related Topics