Force and Motion | Term 1 Unit 2 | 7th Science - Distance - Time Graphs | 7th Science : Term 1 Unit 2 : Force and Motion
Chapter: 7th Science : Term 1 Unit 2 : Force and Motion
Distance - Time Graphs
Figure shows a car travelling along a straight line away from the starting point O.
Distance - Time Graphs
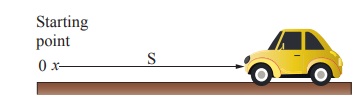
Figure shows a car travelling along
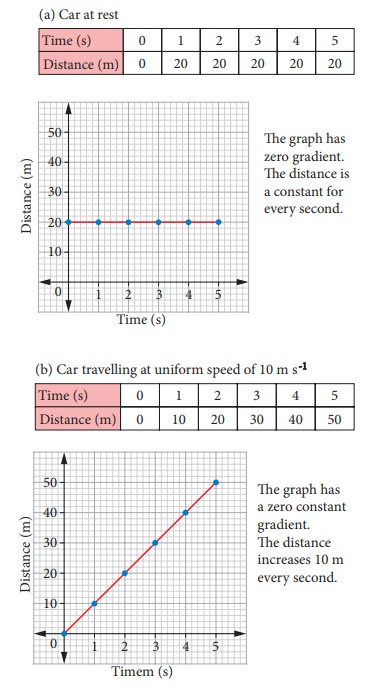
a straight line away from the starting point O. The distance of the car is
measured for every second. The distance and time are recorded and a graph is
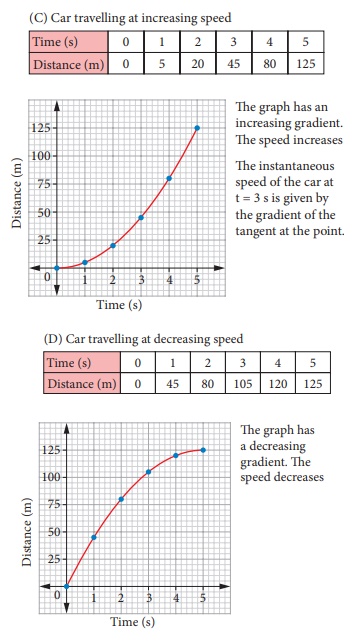
plotted using the data. The results for four possible journeys are shown below.
Tags : Force and Motion | Term 1 Unit 2 | 7th Science , 7th Science : Term 1 Unit 2 : Force and Motion
Study Material, Lecturing Notes, Assignment, Reference, Wiki description explanation, brief detail
7th Science : Term 1 Unit 2 : Force and Motion : Distance - Time Graphs | Force and Motion | Term 1 Unit 2 | 7th Science
Related Topics
7th Science : Term 1 Unit 2 : Force and Motion