Information Processing | Term 1 Chapter 6 | 5th Maths - Pictograph | 5th Maths : Term 1 Unit 6 : Information Processing
Chapter: 5th Maths : Term 1 Unit 6 : Information Processing
Pictograph
Information can be easily understood when they are represented in pictures. (GRAPHICAL REPRESENTATION OF DATA)
GRAPHICAL REPRESENTATION OF DATA
Pictograph
Information can be easily understood
when they are represented in pictures.
A
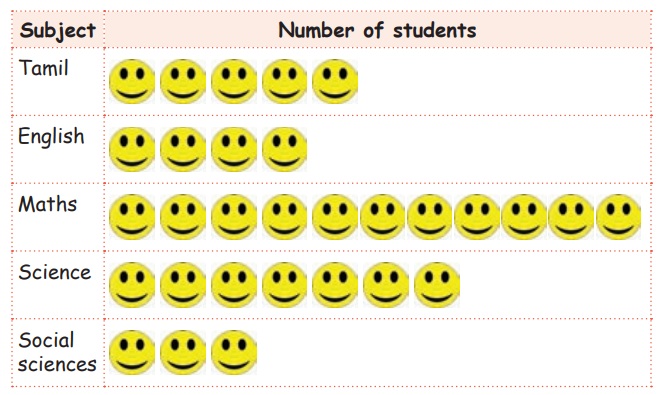
pictograph is the representation of data using pictures. Pictographs
represent the frequency of data while using symbols or images that are relevant
to the data. This is one of the simplest ways to represent data.
Example
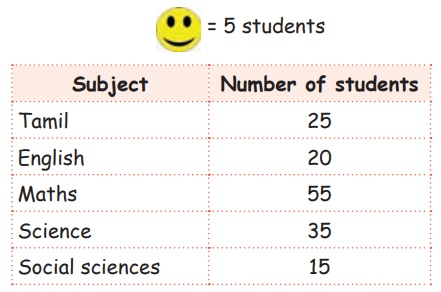
This
is information collected from 150 students about their favourite subjects. Make
a pictograph based on it:
Activity
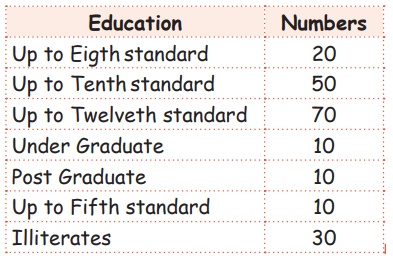
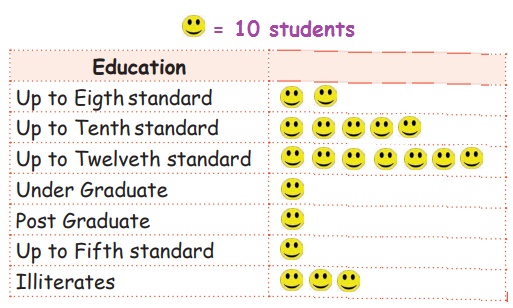
The following information shows the number of literates in a village of 200 people. Draw a pictograph for the data.
Tags : Information Processing | Term 1 Chapter 6 | 5th Maths , 5th Maths : Term 1 Unit 6 : Information Processing
Study Material, Lecturing Notes, Assignment, Reference, Wiki description explanation, brief detail
5th Maths : Term 1 Unit 6 : Information Processing : Pictograph | Information Processing | Term 1 Chapter 6 | 5th Maths
Related Topics
5th Maths : Term 1 Unit 6 : Information Processing