Information Processing | Term 1 Chapter 6 | 5th Maths - Collection of two - dimensional quantitative Data | 5th Maths : Term 1 Unit 6 : Information Processing
Chapter: 5th Maths : Term 1 Unit 6 : Information Processing
Collection of two - dimensional quantitative Data
GRAPHICAL REPRESENTATION OF DATA
Collection of two - dimensional quantitative Data
The easy method to calculate is to
tabulate the collected 2 - dimensional information and represent it in
pictures.
Example 1
Sports day celebration
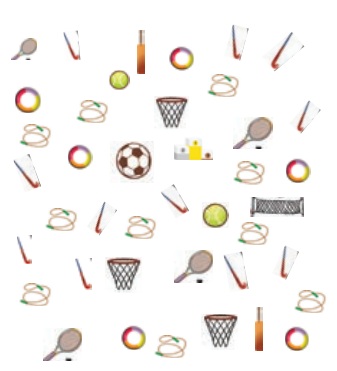
After the Sports day Celebration, the
students kept all the used sports articles in a room. The physical director
asked the students Dinesh & Ganesh from Fifth Standard to arrange the
sports article in order. They tabulated the sports articles as below

Note: Rows are horizontal
arrangements whereas column are vertical arrangements.
Let us know: The
process of arranging classified data in table form is known as tabulation.
Let us see how they arranged in a
proper way

Activity 1
In a Sports day
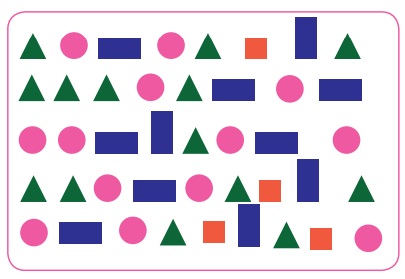
celebration. The Fifth standard students were given a competition of collecting
mathematical shapes. Shakuntaladevi team won the competition.

Let us count the shapes collected by the winning team.

Try this
Can you make a rectangle
using the triangles taken from a square? Yes (4 triangles which is taken from same square can be made
into rectangle)
Example 2
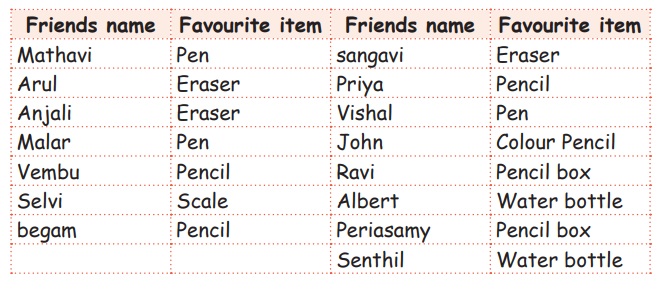
Prabu would like to present some gifts
on his birthday party. He collected the details from his friends.


Activity 2
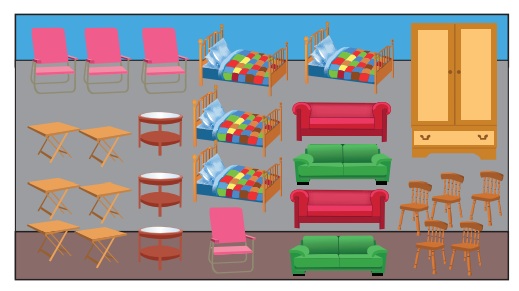
In a house hold articles
mart, total stock was calculated at the end of the month as given below. Answer
the following question.

Questions:
1. How many chairs were
there in the stock list? 5
2. Name the articles which
are lesser than the number of cots.
Almirah and tri footed stools
3. What is the total
number of things in the stock? 27
4. How many tri footed
stools were there? 3
5. Mention the articles
which are 3 greater than tri footed stool? Dining tables.
Do it your self: List
& tabulate the furniture in your school. Chair,
Table, Caboard
Related Topics